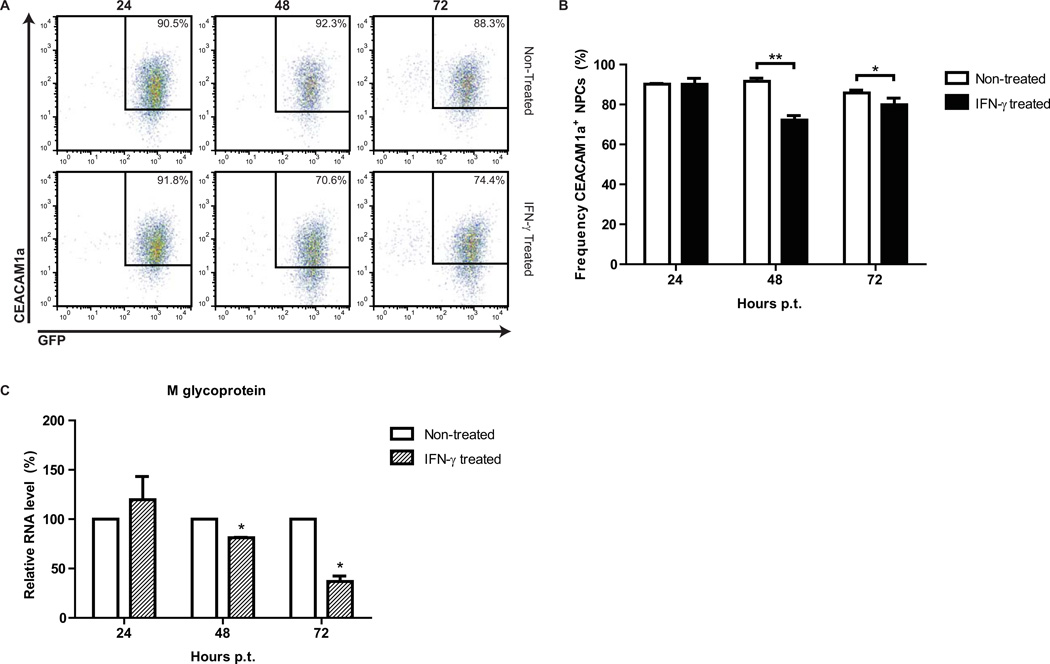
Figure 6. IFN-γ reduces JHMV receptor expression and JHMV transcripts in infected NPCs.
(A) Representative dot plots of CEACAM1a-expressing GFP NPCs at 24, 48, and 72 hours post-IFN-γ-treatment. (B) Quantification of the frequency of CEACAM1a+ NPCs with or without IFN-γ treatment. (C) Relative percent expression of JHMV membrane (M) protein transcripts from infected, IFN-γ-treated NPCs compared to non-infected, non-treated NPCs. For panels B and C, data is presented as average ± SEM and represents 3 independent experiments (*p ≤ 0.05). For panel C, ΔCt values were used for statistical analysis.

