Abstract
The liver is a tolerogenic environment exploited by persistent infections such as hepatitis B (HBV) and C (HCV) viruses. In a murine model of intravenous (IV) hepatotropic adenovirus infection, liver-primed antiviral CD8+ T cells fail to produce pro-inflammatory cytokines and do not display cytolytic activity characteristic of effector CD8+ T cells generated by infection at an extrahepatic, i.e. subcutaneous (SC), site. Importantly, liver-generated CD8+ T cells also appear to have a T regulatory (Treg) cell function exemplified by their ability to limit proliferation of antigen-specific T effector (Teff) cells in vitro and in vivo via Tim-3 expressed by the CD8+ Treg cells. Regulatory activity did not require recognition of the canonical Tim-3 ligand Gal-9 but was dependent on CD8+ Treg cell surface Tim-3 binding to the alarmin HMGB-1. Conclusion: virus-specific Tim-3+CD8+ T cells operating through HMGB-1 recognition in the setting of acute and chronic viral infections of the liver may act to dampen hepatic T cell responses in the liver microenvironment and as a consequence limit immune mediated tissue injury or promote the establishment of persistent infections.
Keywords: immunoregulation, intrahepatic, Treg, adenovirus, cytomegalovirus
Immune cells within the liver are maintained in a state of active tolerance due to continuous exposure to microbe-derived pathogen associated molecular patterns (PAMP), toxins, and food-derived antigens (1). Hepatotropic viruses adapted to persist in the liver have evolved to take advantage of this environment and trigger dysfunctional adaptive immune responses during acute (adenovirus) and chronic (HBV and HCV) virus infections of the liver (2,3). The generation of antiviral CD8+ Teff cells is suboptimal in the liver in part due to defective antigen presentation and a skewed CD4+ Th1/Th2 cell balance resulting in diminished T cell proliferation, decreased production of pro-inflammatory cytokines, and reduced expression of cytolytic effector molecules (4). Understanding the mechanisms that orchestrate liver tolerance is critical for antiviral immunotherapy target selection and development.
Another factor limiting intrahepatic CD8+ T cell responses to infection is the generation of Treg cells (5). Treg cells suppress Teff cell responses through a variety of antigen-specific cell contact dependent/independent mechanisms including IL-2 sequestration, release of anti-inflammatory cytokines (IL-10 and TGF-β) (5), CTLA-4 co-stimulation (6), Fas/FasL or perforin killing (7,8), granzyme B (GrB) negative feedback (9), and PD-1/PD-L1 signaling (10). Notably, intrahepatic CD8+ T cells responding to acute and chronic HCV infections are capable of producing IL-10 and co-express PD-1/PD-L1 and Tim-3. Compelling evidence suggests that simultaneous blockade of these regulatory elements improves intrahepatic immunity prompting the development of novel therapeutics (11,12). CD8+ T cell derived IL-10 appears to reduce IL-12R, IL-2, IFN-γ, and Tbet expression through an autocrine mechanism (13). Programmed death 1 (PD-1), upon engagement with PD-1 ligand (PD-L1), suppresses CD8+ T cell responses via direct SHP-2-mediated dephosphorylation events and modulation of Ca++ fluxes downstream of T cell receptor (TCR) signaling (14). Furthermore, Gal-9 is abundant in the liver, is induced during viral infection by IFN-γ, and upon engagement of T cell immunoglobulin and mucin 3 (Tim-3) dampens CD8+ T cell IL-2, IFN-γ, and proliferation (15). Gal-9 recognizes N- and O-linked glycosylation sites of the Tim-3 mucin region. However, E. coli-derived recombinant Tim-3 tetramers, inherently lacking oligosaccharides, can bind to B cells, T cells, dendritic cells (DC), and macrophages, suggesting other non-Gal-9 ligands for Tim-3 exist (16).
High-mobility group box 1 (HMGB-1) was recently discovered to bind the FG cleft in the immunoglobulin variable region of Tim-3 within DC endosomes (17). HMGB-1, originally identified as a DNA binding protein, is classified under the alarmins, which relay danger associated molecular pattern (DAMP) signals to antigen presenting cells (APC). Although passively released by necrotic cells, active secretion of HMGB-1 from monocytes, macrophages, DCs, and NK cells has been observed (18). Upon binding the receptor for advanced glycation end products (RAGE) expressed by DCs and T cells, HMGB-1 can directly stimulate DC maturation and T cell proliferation (19,20).
During an analysis of CD8+ T cell responses following infection with hepatotropic adenovirus, we hypothesized that antiviral intrahepatic CD8+ T cells had Treg cell properties likely dependent on production of IL-10, display of Gal-9, and/or expression of PD-L1. However, we observed that the PD-1/PD-L1+Tim-3+CD8+ T cells did not produce Gal-9; moreover, administration of blocking antibodies to IL-10, PD-L1, and Gal-9 indicated that CD8+ Treg cell suppression was not dependent on these mechanisms. Surprisingly, we found that Tim-3 displayed on the surface of intrahepatic CD8+ Treg cells sequesters HMGB-1 thereby limiting augmentation of CD8+ Teff cell proliferation. The capture of HMGB-1 by Tim-3 on the surface of CD8+ Treg cells offers an attractive explanation for the inability of CD8+ Teff cells to generate efficient antiviral responses in the liver.
MATERIALS AND METHODS
Animals and Infections
Thy1.2+/+, Thy1.1+/−OT-I(Tcra/Tcrb)+/−(Taconic Farms, Hudson, NY), and IL-10 transcriptional reporter (Vert-X) mice provided by Christopher Karp (University of Cincinnati College of Medicine, Cincinnati, OH) were used in these experiments. Animals were 6 to 10 weeks of age and housed in a pathogen-free facility under protocols approved by the Institutional Animal Care and Use Committee at the University of Virginia (Charlottesville, VA).
Replication-deficient type 5 adenoviruses expressing ovalbumin (Ad-Ova) and β-galactosidase (Ad-LacZ) were provided by Timothy L. Ratliff (University of Iowa, Iowa City, IA) and Gregory A. Helm (University of Virginia), respectively. Mouse cytomegalovirus expressing ovalbumin (MCMV-Ova) was provided by Ann B. Hill (Oregon Health and Science University, Portland, Oregon). Mice were infected with 2.5×10⁷ infectious units (IU) Ad-Ova/LacZ or 1×10⁴ IU MCMV-Ova via intravenous (IV) injection in the caudal vein or subcutaneous (SC) injection in the left flank.
Quantitative PCR
Total RNA was isolated using the Trizol method (Invitrogen, Carlsbad, CA) and reverse-transcribed using High Capacity RNA-to-cDNA Master Mix (Applied Biosystems, Foster City, CA). Q-PCR was performed using Fast SYBR Green Master Mix (Applied Biosystems) on an AB StepOne Plus Real-Time PCR System. QuantiTect primers for Mus musculus Il10, Il2, Ifng, Tgfb, Lgals9, Havcr2, Pdl1, Pdc1, Ctla4, Klrc1, Foxp3, Ikzf2 (Qiagen, Valencia, CA), and self-designed primers for Mus musculus hypoxanthine phosphoribosyltransferase (Hprt1; forward, 5′-CTCCGCCGGCTTCCTCCTCA-3′; reverse, 5′-ACCTGGTTCATCATCGCTAATC-3′) were used for detection.
ELISA
IL-2, IL-10, and IFN-γ ELISAs were performed according to the manufacturer’s instructions (BD Biosciences, Franklin Lakes, NJ). Absorbance was read at 450 nm using a PowerWave XS Microplate Spectrophotometer (BioTek, Winooski, VT).
Immunoprecipitation and Western Blot
5 μg of recombinant mouse Tim-3 human IgG1 chimeric protein (rTim-3Fc) (R&D Systems, Minneapolis, MN) was added to 500 μL supernatant and immunoprecipitated with Protein A/G PLUS-Agarose (Santa Cruz Biotechnology, Dallas, TX). Proteins were resolved, western blotted, and incubated with rabbit anti-HMG1/2/3 (pAb) (Santa Cruz Biotechnology), biotinylated anti-human IgG (pAb) (SouthernBiotech, Birmingham, AL), HRP-linked anti-rabbit IgG (pAb) (Cell Signaling Technology, Danvers, MA), and streptavidin-HRP (R&D Systems) followed by visualization with SuperSignal West Pico Chemiluminescent Substrate (Thermo Scientific, Rochester, NY).
Liver and Spleen Mononuclear Cell Isolation
Mononuclear cells were isolated from livers via Histodenz (Sigma-Aldrich, St. Louis, MO) gradient centrifugation and spleens over a Ficoll (Atlanta Biologicals, Lawrenceville, GA) gradient according to previous work (2).
In Vitro Suppression Assay
Bone marrow-derived dendritic cells (BMDC) were matured for one week in RPMI Medium 1640 containing 10% HyClone fetal bovine serum, 15 mM HEPES Buffer, 50 μM βME, 20 ng/mL rIL-4, and 20 ng/mL rGM-CSF (eBioscience, San Diego, CA). 5×10³ BMDCs were pulsed for 5 hrs with 10 ng/mL SIINFEKL or ICPMYARV peptides (AnaSpec, Fremont, CA), then cultured with 5×10⁴ CFSE-labeled (Invitrogen) naïve Thy1.1+CD8+ OT-I T cells. CD8+ T cells from SC or IV infected C57BL/6 mice were then added at the appropriate ratio. CD8+ T cells were positively sorted using anti-CD8α magnetic beads (Miltenyi Biotec, Auburn, CA).
In Vivo Suppression Assay
For in vivo liver responses, 5×10⁵ CFSE-labeled naïve Thy1.1+CD8+ OT-I T cells were transferred into naïve, D7 Ad-Ova infected, or D7 Ad-LacZ infected mice prior to IV MCMV-Ova infection. For in vivo lymph node responses, 3×10⁶ CD8+ T cells from SC or IV infected C57BL/6 mice were co-transferred with 1.5×10⁶ CFSE-labeled naïve Thy1.1+CD8+ OT-I T cells into SC infected C57BL/6 mice at D0.
Antibody Blockade and Cell Treatments
In vivo whole animal blockade of HMGB-1, PD-L1, and Tim-3 was conducted via intraperitoneal (IP) injection of 300 μg anti-HMGB-1 (pAb) (Shino-Test Corporation, Kanagawa, Japan), anti-PD-L1 (10F.9G2), or anti-Tim-3 (RMT3-23) (BioXCell, West Lebanon, NH). For in vitro and in vivo lymph node blockade, CD8+ Treg cells were pre-coated with 20 μg/mL anti-PD-L1 and/or anti-Tim-3 for 1 hr at 37°C. 1.0 μg/mL recombinant mouse Gal-9 (rGal-9) (R&D Systems), 20 μg/mL anti-Gal-9 (RG9-1), 20 μg/mL anti-IL-10R (1B1.3A) (BioXCell), and 0.5 μg/mL anti-HMGB-1 (pAb) (eBioscience) were added to culture media in relevant experiments.
Flow Cytometry
Antibodies from BD Biosciences, Biolegend, eBioscience, and R&D Systems were used for detection. H2-Kb Ova-tetramer APC (Baylor College of Medicine, Houston, TX) and H2-Kb βGal-tetramer PE (NIAID, Atlanta, GA) identified antigen-specific CD8+ T cells. 1.5×10⁶ mononuclear cells were blocked with anti-CD16/CD32 (2.4G2) (University of Virginia) followed by specific antibody labeling. Nuclear transcription factor staining was achieved using the FoxP3 Staining Set (eBioscience). For intracellular cytokine detection, cells were re-stimulated with 5 ng/mL PMA and 500 ng/mL ionomycin (Sigma-Aldrich) or 2 μg/mL SIINFEKL peptide (AnaSpec) and blocked with 1 μL/mL GolgiPlug/GolgiStop (BD Biosciences). Data were collected on a BD FACS Canto II (BD Immunocytometry Systems, San Jose, CA) and analyzed using FlowJo 8.8.6 software (Tree Star Inc., Ashland, OR). Cells were FACS-sorted on an iCyt Reflection Cell Sorter (iCyt Mission Technology, Champaign, IL).
Microscopy
Human HCC and HCV liver biopsies kindly provided by the Biorepository and Tissue Research Facility and Valeria R. Mas (University of Virginia), respectively, were fixed in chilled acetone for 2 min. Mouse tissues were flushed with 1×PBS and periodate-lysine-paraformaldehyde fixative (PLP), excised, incubated in PLP for 3 hrs at 4°C, and passed over a sucrose gradient. Tissues were frozen in OCT, sectioned at 5 μm thickness, blocked with 2.4G2 solution (2.4G2 media containing anti-CD16/32, 30% chicken/donkey/horse serum, and 0.1% NaN3), and stained with antibodies from BioLegend, eBioscience, Santa Cruz Biotechnology, and Sino Biological. In select experiments, cells were also labeled with CFSE and Vybrant CM-DiI (Invitrogen). Confocal microscopy was performed on a Zeiss LSM-700, and data were analyzed using Zen 2009 Light Edition software (Carl Zeiss MicroImaging GmbH, Jena, Germany).
Statistical Analysis
Significant differences between experimental groups were calculated using the two-tailed Student’s t test or one-way ANOVA (with group comparisons ≥ 3). Data analysis was performed using Prism 5.0a software (GraphPad Software Inc., La Jolla, CA). Values of P < 0.05 were regarded as being statistically significant and noted as * < 0.05, ** < 0.01, and *** < 0.001.
RESULTS
Liver-primed CD8+ T cells exert a Treg suppressor function on the priming of naïve CD8+ T cells in vitro via linked suppression
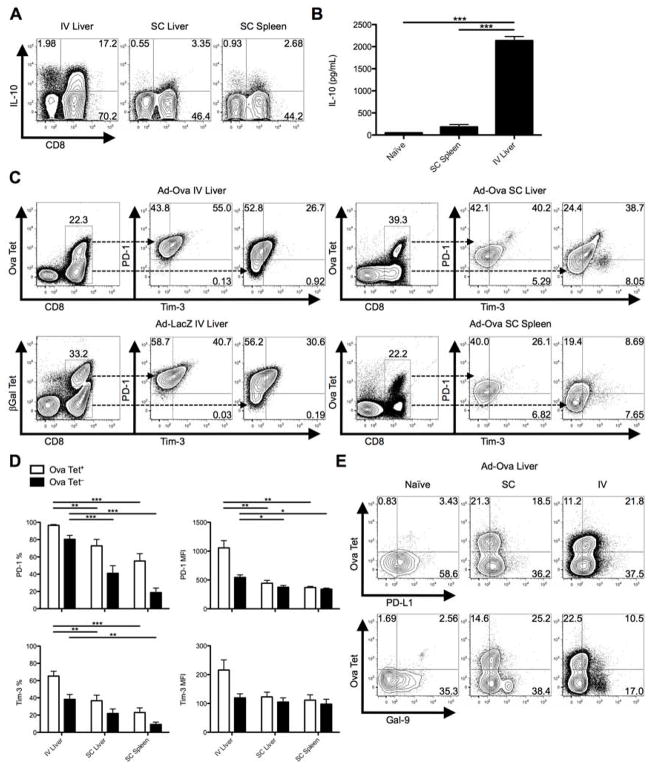
IV adenovirus infection of mice is characterized by a decrease in target cell lysis from day 7 (D7) to D14 exemplified by a drop in serum ALT. Antigen-specific CD8+ T cells primed directly in the liver after IV infection peak in absolute number at D7 but fail to produce TNF-α, IFN-γ, and GrB compared to CD8+ T cells that have trafficked to the liver from the inguinal lymph node (Ig LN) in response to SC adenovirus inoculation (Supporting Fig. 1) (2). To expand our studies upon the potential roles of anti-inflammatory mediators utilized by liver-primed CD8+ T cells, we examined cellular production of IL-10 and the expression of PD-1/PD-L1 and Tim-3. After IV infection with adenovirus expressing ovalbumin (Ad-Ova), liver CD8+ T cells had elevated intracellular IL-10 at D7 compared to SC generated CD8+ T cells (Fig. 1A). The secretion of IL-10 was also detectable in culture supernatants of TCR-stimulated CD8+ T cells sorted from the IV infected liver (Fig. 1B). PD-1 and Tim-3 co-expression peaked at D7 (Supporting Fig. 2) and was significantly enriched on Ova Tet+CD8+ T cells in the livers of IV infected mice (Fig. 1C,D). In spite of the lower absolute number of CD8+ T cells infiltrating the livers and spleens of SC infected mice, the frequency of Ova-specific CD8+ T cells was comparable between IV and SC infections. IV infection with adenovirus expressing β-galactosidase (Ad-LacZ) yielded comparable results (Fig. 1C). Route of infection had no impact on the expression of PD-L1 in the liver. The expression of the Tim-3 ligand Gal-9 was readily detectable on naïve and SC CD8+ T cells, but only low expression was observed on liver-primed CD8+ T cells (Fig. 1E).
Fig. 1. IL10, PD-1, and Tim-3 are co-expressed on liver-primed CD8+ T cells after IV adenovirus infection.
C57BL/6 mice were SC or IV infected with 2.5×10⁷ IU Ad-Ova. (A) Endogenous D7 liver and spleen T cell IL-10 production was assessed after a 5 hr re-stimulation with 5 ng/mL PMA and 500 ng/mL ionomycin (n = 3 per group). (B) CD8+ T cells sorted from naïve liver, D7 SC spleen, and D7 IV liver were re-stimulated in vitro with plate-bound anti-CD3ε Ab and soluble anti-CD28 Ab. The concentration of IL-10 was measured in the D2 culture supernatant by ELISA (one-way ANOVA/Tukey’s post test; n = 3 per group). (C and D) Co-expression of PD-1 and Tim-3 was determined directly ex vivo for Ova Tet+ and Ova Tet− populations of CD8+ T cells at D7 post-infection. Ad-Ova IV infection in the liver was also compared to D7 livers from Ad-LacZ IV infected C57BL/6 mice (one-way ANOVA/Tukey’s post test; n = 4–9 per group). (E) PD-L1 and Gal-9 ligand expression was characterized in livers of naïve, SC, and IV Ad-Ova infected animals (n = 3–6 per group). Numbers in the scatter plots represent percentages. Mean ± s.e.m.; *P < 0.05, **P < 0.01, and ***P < 0.001.
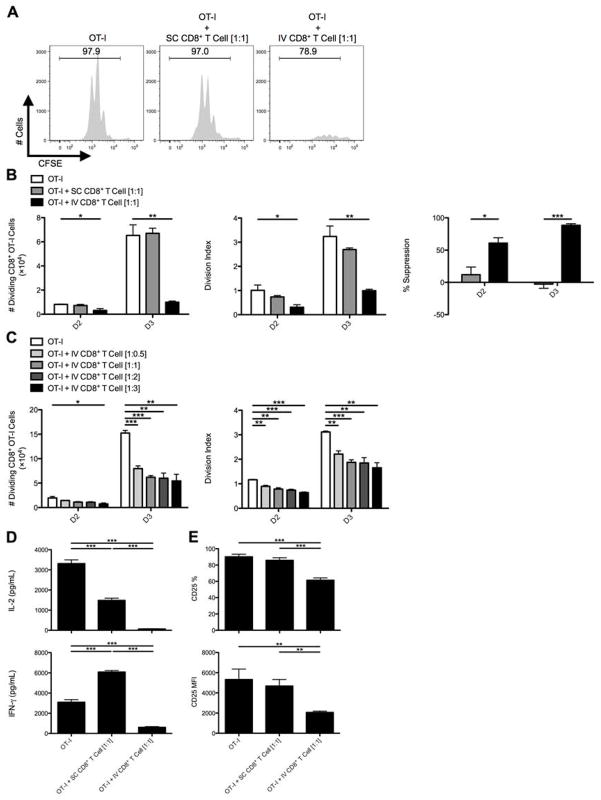
Since IL-10-producing, PD-1/PD-L1+Tim-3+CD8+ T cells appeared at a late time point post-adenovirus infection (D7), we hypothesized that liver-primed CD8+ T cells, rather than acting as effector cells, contribute to limiting local inflammatory responses by suppressing Teff cells migrating to the hepatic microenvironment. To test this, we utilized an in vitro system employing TCR transgenic OT-I T cells, where Thy1 congenically mismatched CFSE-labeled naïve CD8+ OT-I T cells were placed in co-culture with CD8+ T cells isolated from the infected D7 SC spleens or IV livers. BMDCs pulsed with ovalbumin octapeptide (Ova257-264:SIINFEKL) served as the APC. CD8+ T cells isolated from the D7 livers of IV adenovirus infected mice had markedly suppressed OT-I T cell proliferative expansion by D2 to D3 of culture as evident from the absolute number and division index of dividing OT-I T cells, while CD8+ T cells isolated from the D7 SC spleens had no suppressive effect (Fig. 2A,B). Suppression was observed over a range of OT-I:IV CD8+ T ratios (Fig. 2C). Significantly less IL-2 and IFN-γ could be detected in the supernatants collected from OT-I/IV CD8+ T cell co-cultures (Fig. 2D) along with diminished CD25 expression on OT-I T cells exposed to liver-primed CD8+ T cells (Fig. 2E). The regulatory activity mediated by these liver-primed CD8+ Treg cells was also dependent on TCR recognition of specific antigen (Supporting Fig. 3), suggesting liver-primed CD8+ Treg cells mediate suppression in an antigen-specific manner. Liver-primed CD8+ Treg cells did not appear to induce cell death in responder OT-I T cells (Supporting Fig. 4).
Fig. 2. CD8+ T cells from the livers of IV infected animals suppress the activation and expansion of naïve CD8+ OT-I T cells in vitro.
C57BL/6 mice were SC or IV infected with 2.5×10⁷ IU Ad-Ova, and (A) bulk CD8+ T cells were isolated from D7 SC spleens and IV livers then cultured with CFSE-labeled naïve Thy1.1+CD8+ OT-I T cells at a 1:1 ratio. SIINFEKL-pulsed BMDCs were used as the source of antigen, and co-cultures were analyzed at D3. (B) The number of dividing OT-I T cells, OT-I T cell division index, and percent suppression displayed by either SC CD8+ T cells or IV CD8+ T cells was calculated at D2 and D3 of culture (one-way ANOVA/Tukey’s post test; n = 12 per group). (C) Naïve Thy1.1+CD8+ OT-I T cells were also cultured at various ratios relative to CD8+ T cells collected from the livers of IV infected mice (1:0.5, 1:1, 1:2, and 1:3) (one-way ANOVA/Tukey’s post test; n = 3 per group). (D) The concentrations of IL-2 and IFN-γ were measured in the D3 culture supernatants by ELISA, and (E) CD25 expression was determined directly ex vivo on D3 Thy1.1+CD8+ OT-I T cells (one-way ANOVA/Tukey’s post test; n = 5–6 per group). Numbers in the histograms represent percentages. Mean ± s.e.m.; *P < 0.05, **P < 0.01, and ***P < 0.001.
Cellular markers and properties associated with liver-primed CD8+ Treg cells
Hallmarks of CD4+ Treg cells include FoxP3 and CD25 expression, lack of IL-2 production, and failure to undergo robust clonal expansion following TCR/antigen exposure. We analyzed a panel of markers and found that the intrahepatic Ova Tet+CD8+ Treg cells had markedly diminished Il2 mRNA, lacked enhanced Foxp3 mRNA, but maintained elevated levels of Il10, Havcr2 (Tim-3), Pdc1 (PD-1), and Ikzf2 (Helios) mRNA compared to Ova Tet−CD8+ T cells (Fig. 3A). Intracellular Helios and cell surface GITR was expressed by the Ova Tet+CD8+ Treg cells, but surface CD25 and surface/intracellular CTLA-4 was not detectable (Fig. 3B). It has been reported that expression of inhibitory Ly49 receptors along with restriction of Qa-1 recognition define a subset of CD8+ Treg cells (8). We could not detect surface expression of Ly49 receptors on these liver CD8+ T cells, but low-level expression of NKG2A and Qa-1 was detected (Fig. 3B; data not shown, respectively).
Fig. 3. eGFP+CD8+ Treg cells are more potent suppressors compared to eGFP−CD8+ Treg cells from IL-10 transcriptional reporter mice and display some canonical Treg markers.
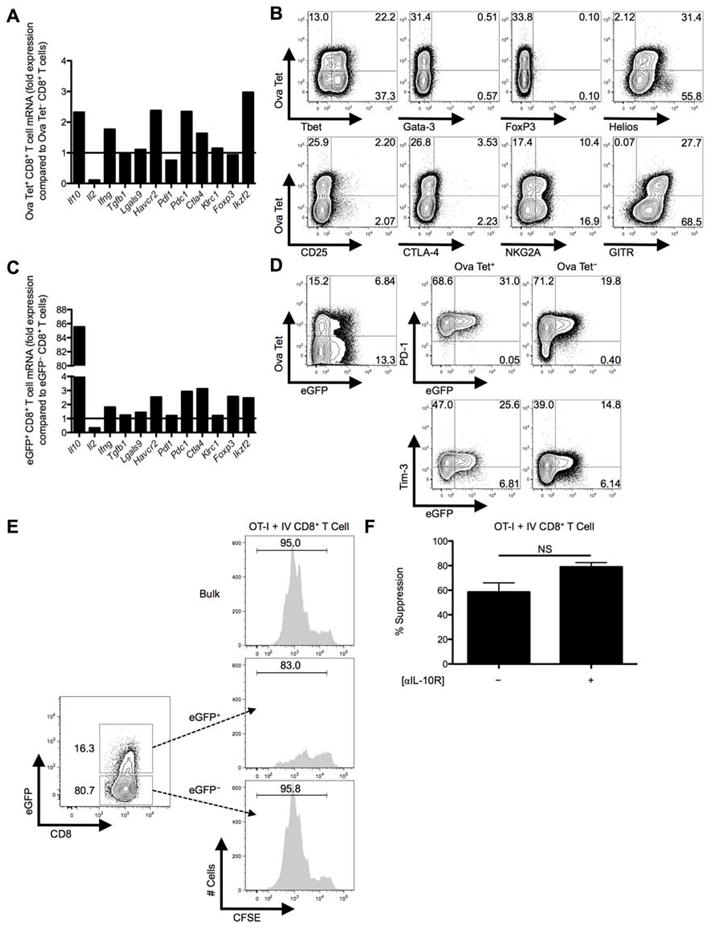
C57BL/6 mice were IV infected with 2.5×10⁷ IU Ad-Ova, D7 liver mononuclear cells were isolated, and total RNA was collected from FACS-sorted Ova Tet+ and Ova Tet−CD8+ Treg cells. (A) Il10 (IL-10), Il2 (IL-2), Ifng (IFN-γ), Tgfb (TGF-β), Lgals9 (Gal-9), Havcr2 (Tim-3), Pdl1 (PD-L1), Pdc1 (PD-1), Ctla4 (CTLA-4), Klrc1 (NKG2A), Foxp3 (FoxP3), and Ikzf2 (Helios) mRNA was measured by Q-PCR. (B) Expression of intranuclear/cellular Tbet/Gata-3/FoxP3/Helios, and surface CD25/CTLA-4/NKG2A/GITR was determined on CD8+ Treg cells from the livers of IV infected mice. (C) Similarly, transcript from FACS-sorted eGFP+CD8+ Treg cells was compared to that of eGFP−CD8+ Treg cells from D7 IV infected Vert-X mice. (D) PD-1 and Tim-3 surface expression along the eGFP profile was separately assessed on Ova Tet+ and Ova Tet−CD8+ Treg cells (n = 3 per group). (E) Representative in vitro suppression assays from bulk CD8+ Treg cells and FACS-sorted eGFP+CD8+ Treg cells or eGFP−CD8+ Treg cells from D7 Ad-Ova IV infected C57BL/6 and Vert-X mice, respectively, co-cultured with CFSE-labeled naïve Thy1.1+CD8+ OT-I T cells at a 1:1 ratio are depicted (n = 3 per group). (F) D3 percent suppression by D7 Ad-Ova liver-primed CD8+ Treg cells during co-culture with CFSE-labeled naïve Thy1.1+CD8+ OT-I T cells at a 1:1 ratio and SIINKFEKL-pulsed BMDCs is displayed. Select wells also contained anti-IL-10R Ab in the media during culture (n = 3 per group). Numbers in the histograms and scatter plots represent percentages.
To explore the role of IL-10, we infected IL-10 transcriptional reporter eGFP expressing (Vert-X) mice with Ad-Ova and FACS-sorted eGFP+ and eGFP−CD8+ T cells from the D7 liver. eGFP+CD8+ T cells maintained elevated Havcr2, Pdc1, and Ikzf2 mRNA compared to eGFP−CD8+ T cells (Fig. 3C), and eGFP expression positively correlated with PD-1 and Tim-3 expression (Fig. 3D). Given these observations, we explored the IL-10 pathway and other regulatory mechanisms (e.g. PD-1/PD-L1 and Tim-3) to account for the suppressive activity of the liver-primed CD8+ Treg cells.
CD8+ Treg cells suppress Teff cells in a Tim-3-dependent manner
When we compared the suppressive activity of liver eGFP+ and eGFP−CD8+ Treg cells we found that eGFP+CD8+ Treg cells were more effective at suppressing OT-I T cell division in vitro (Fig. 3E) presumably due to IL-10 secretion and possibly elevated expression of the regulatory molecules PD-1/PD-L1 and Tim-3. However, anti-IL-10R antibody could not reverse suppression (Fig. 3F). These data indicate that IL-10 phenotypically marks the CD8+ Treg cell but does not have a central role in suppression.
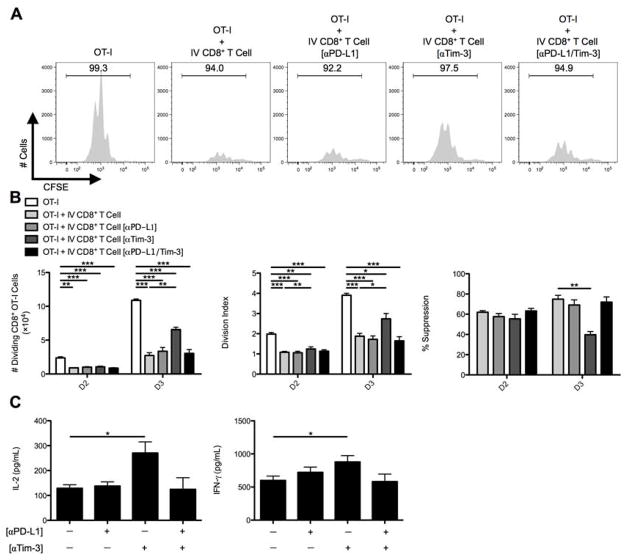
CD8+ Treg cells were then pre-coated with anti-PD-L1, anti-Tim-3, or both antibodies. Anti-PD-L1 antibody had no effect, but anti-Tim-3 antibody partially rescued OT-I T cell division (Fig. 4A,B). Tim-3 blockade also resulted in enhanced release of IL-2 and IFN-γ into the supernatants collected from OT-I/IV CD8+ Treg cell co-cultures (Fig. 4C). Thus, Tim-3 blockade appeared to inhibit CD8+ Treg cell ability to suppress CD8+ Teff cells.
Fig. 4. In vitro CD8+ Treg cell suppression is dictated by the Tim-3 inhibitory pathway.
C57BL/6 mice were IV infected with 2.5×10⁷ IU Ad-Ova, and (A) bulk CD8+ Treg cells were isolated from D7 IV livers. Before co-culture with CFSE-labeled naïve Thy1.1+CD8+ OT-I T cells at a 1:1 ratio and SIINKFEKL-pulsed BMDCs, the CD8+ Treg cells were left alone or pre-coated with anti-PD-L1 Ab, anti-Tim-3 Ab, or both. Cell cultures were analyzed at D3 for CFSE dilution. (B) The number of dividing OT-I T cells, OT-I T cell division index, and percent suppression displayed by IV CD8+ Treg cells was calculated at D2 and D3 of culture. (C) The concentrations of IL-2 and IFN-γ were measured in the D3 culture supernatants by ELISA (one-way ANOVA/Tukey’s post test; n = 6–9 per group). Numbers in the histograms represent percentages. Mean ± s.e.m.; *P < 0.05, **P < 0.01, and ***P < 0.001.
Nascent CD8+ T cell expansion during liver and lymph node antiviral responses is suppressed by liver-primed CD8+ Treg cells in vivo
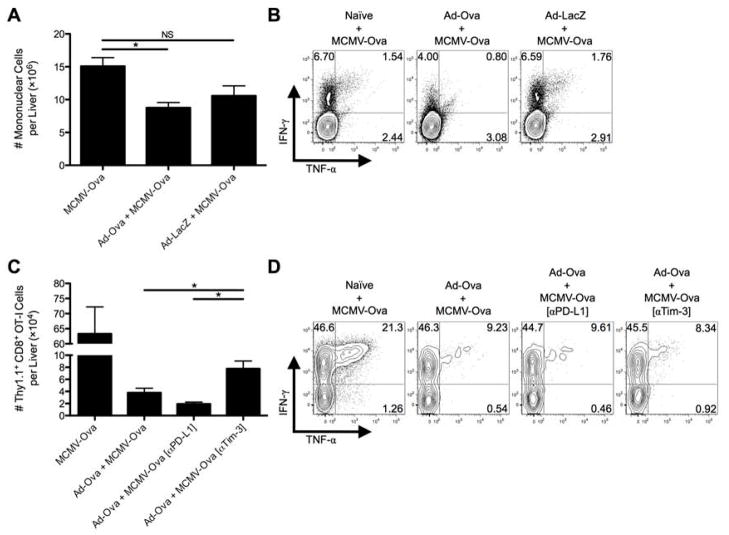
We next examined whether liver-primed CD8+ Treg cells could regulate the expansion of endogenous CD8+ Teff cells in vivo. To this end, naïve, Ad-Ova, or Ad-LacZ infected mice were re-infected with mouse cytomegalovirus expressing ovalbumin (MCMV-Ova) at D7 post-adenovirus infection, and D14 livers were analyzed. Seven days following MCMV-Ova infection, the absolute number of viable mononuclear cells in the livers of mice previously immunized with Ad-Ova was reduced compared to Ad-LacZ infected, MCMV-Ova challenged animals (Fig. 5A). Further, animals undergoing initial Ad-Ova infection had reduced frequencies of IFN-γ+ and TNF-α+IFN-γ+ antigen-specific CD8+ T cells (Fig. 5B). These results support and reinforce our in vitro data and implicate CD8+ Treg cells within the infected liver as the mediators of suppression operating in an antigen-specific manner.
Fig. 5. Tim-3 blockade improves antigen-specific hepatic secondary immune responses to viral infection.
C57BL/6 mice were IV infected with 2.5×10⁷ IU Ad-Ova, 2.5×10⁷ IU Ad-LacZ, or left uninfected. At D7, all 3 experimental groups were IV infected with 1×10⁴ IU MCMV-Ova. (A) The number of live mononuclear cells isolated from the livers of D14 infected animals was enumerated. Trypan blue exclusion was used to assess the number of viable cells. (B) Endogenous CD8+ T cell TNF-α and IFN-γ were quantified at D14 after a 5 hr re-stimulation with 2 μg/mL SIINFEKL peptide (n = 3 per group). (C and D) In a parallel experiment, 5×10⁵ naïve Thy1.1+CD8+ OT-I T cells were transferred at D7. C57BL/6 mice were left untreated or were administered 300 μg anti-PD-L1 Ab or anti-Tim-3 Ab IP at D5 and D6 prior to a D7 MCMV-Ova infection. The number of Thy1.1+CD8+ OT-I T cells and their TNF-α and IFN-γ production was assessed in the livers of infected animals at D14. Cytokine detection was achieved after a 5 hr re-stimulation with 2 μg/mL SIINFEKL peptide (one-way ANOVA/Tukey’s post test; n = 3 per group). Numbers in the scatter plots represent percentages. Mean ± s.e.m.; *P < 0.05.
To further demonstrate the in vivo suppressive effect of CD8+ Treg cells, Thy1.1+CD8+ OT-I T cells were adoptively transferred into naïve and D7 Ad-Ova infected mice prior to MCMV-Ova infection. The numbers of Thy1.1+CD8+ OT-I T cells in the livers of mice previously infected with Ad-Ova were reduced but were partially recovered via IP delivery of anti-Tim-3 antibody at D5 and D6 (Fig. 5C). No improvements in the frequencies of IFN-γ+ and TNF-α+IFN-γ+ antigen-specific CD8+ T cells were observed (Fig. 5D). These observations support the concepts that the regulatory effect of CD8+ Treg cells is antigen-specific and that Tim-3 plays an important role in mediating suppression.
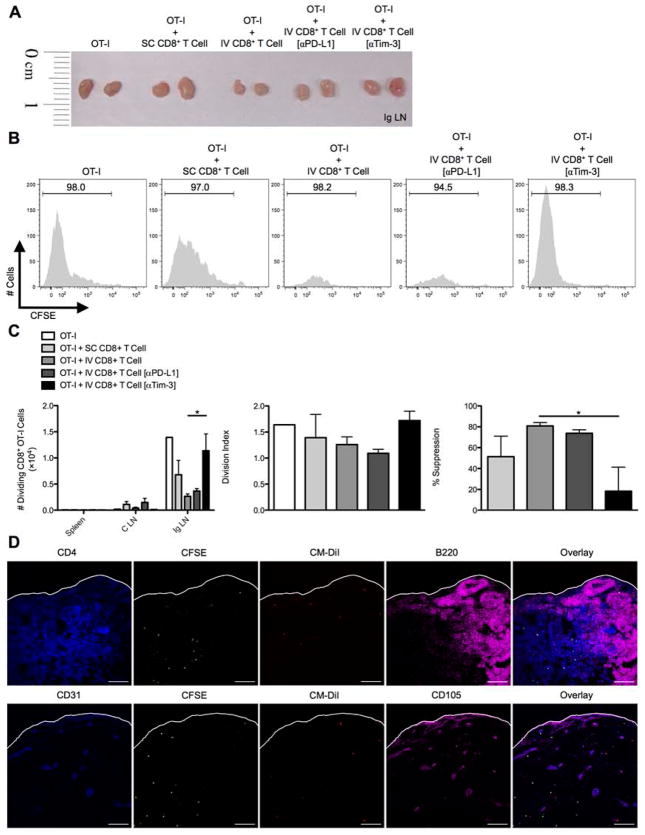
To more directly demonstrate the immunoregulatory effect of liver-primed CD8+ Treg cells on antigen-specific CD8+ Teff cell responses in vivo, D7 Ad-Ova SC splenic CD8+ T cells, D7 IV liver CD8+ Treg cells, and CFSE-labeled naïve Thy1.1+CD8+ OT-I T cells were adoptively transferred into naïve Thy1.2+/+ C57BL/6 mice. IV CD8+ Treg cells were pre-treated with anti-Tim-3 antibody (or control anti-PD-L1 antibody) prior to transfer. The recipients were then SC infected with Ad-Ova and the Ig LNs were analyzed at D3. A notable reduction in the size of the draining Ig LN was observed in mice that had received IV CD8+ Treg cells, and this was reversed with anti-Tim-3 antibody treatment (Fig. 6A). Within the draining Ig LN, IV CD8+ Treg cells suppressed OT-I T cell division. Pre-treating IV CD8+ Treg cells with anti-Tim-3 antibody prior to adoptive transfer restored OT-I T cell proliferation kinetics in vivo comparable to animals that had received OT-I T cells alone (Fig. 6B,C). We also confirmed both IV CD8+ Treg cells and OT-I T cells were trafficking to the T cell zone within the Ig LN by D2 (Fig. 6D). Collectively, these data imply IV CD8+ Treg cells suppress CD8+ Teff cell proliferation via surface Tim-3 both in vitro and in vivo.
Fig. 6. In vivo CD8+ Treg cell suppression of SC-primed OT-I cells entering draining lymph nodes is regulated by Tim-3.
C57BL/6 mice were SC or IV infected with 2.5×10⁷ IU Ad-Ova, and bulk CD8+ T cells were isolated from D7 SC spleens and IV livers. D7 CD8+ Treg cells from IV infected livers were left alone or pre-coated with anti-PD-L1 Ab or anti-Tim-3 Ab. CFSE-labeled naïve Thy1.1+CD8+ OT-I T cells were adoptively transferred alone or in combination with CD8+ T cells from infected spleens and livers at a 1:2 ratio, respectively, into naïve C57BL/6 mice. Shortly thereafter, these recipient mice were SC infected. At D3 post-infection, the spleens, celiac lymph nodes (C LN), and (A and B) inguinal lymph nodes (Ig LN) were harvested, and (C) the number of dividing OT-I T cells was determined in each organ. The division index and percent suppression of OT-I T cells in the Ig LN is displayed (one-way ANOVA/Tukey’s post test; n = 3–6 per group). (D) CM-DiI-labeled CD8+ Treg cells from D7 IV infected liver (red) and CFSE-labeled naïve Thy1.1+CD8+ OT-I T cells (green) were transferred in a similar experiment and Ig LNs were harvested at D2 SC post-infection. PLP-fixed/OCT-frozen Ig LN cross sections were stained with anti-CD4 (blue-upper panel), anti-CD31 (blue-lower panel), anti-B220 (magenta-upper panel), and CD105 (magenta-lower panel) (n = 3 per group). Scale bar, 100 μm. Numbers in the histograms represent percentages. Mean ± s.e.m.; *P < 0.05.
Tim-3/HMGB-1 binding and internalization mediates CD8+ Treg cell suppression independently of Gal-9
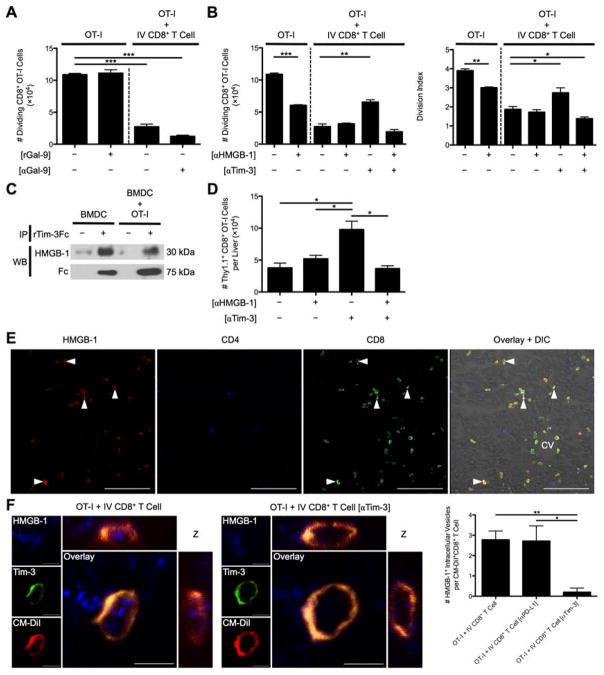
We next examined the mechanism for Tim-3-dependent suppression employed by liver-primed CD8+ Treg cells. Gal-9 appeared to be uninvolved because neither rGal-9 impeded OT-I cell division nor addition of anti-Gal-9 antibody to the media of OT-I/IV CD8+ Treg cell co-cultures reversed suppression (Fig. 7A). Tim-3 acted intrinsically on the IV CD8+ Treg cell highlighted by anti-Tim-3 antibody pre-coating of IV CD8+ Treg cells and lack of Tim-3 receptor expression on responder OT-I T cells (Supporting Fig. 5). HMGB-1 has been recently reported to bind Tim-3 within the early endosomes of DCs (17). These data raised the possibility that Tim-3 displayed by liver-primed CD8+ Treg cells may bind HMGB-1 to limit T cell activation and subsequent proliferation. To test this possibility, we examined the impact of HMGB-1 blockade on OT-I T cell proliferation in culture with Ova257-264 pulsed BMDCs with or without CD8+ Treg cells. Consistent with published results, blockade of HMGB-1 diminished OT-I T cell proliferation in cultures devoid of CD8+ Treg cells. However, in OT-I/IV CD8+ T cell co-cultures the expected decrease in OT-I T cell proliferation was observed, which was unaffected by HMGB-1 blockade. Thus, the CD8+ Treg cells might suppress independently of HMGB-1 or control the concentration of HMGB-1 through a Tim-3-dependent mechanism. When we examined the contribution of Tim-3 displayed by CD8+ Treg cells on OT-I proliferation by pre-coating the CD8+ Treg cells with anti-Tim-3 antibody, Tim-3 blockade partially reversed CD8+ Treg cell mediated suppression as before. Moreover, simultaneous blockade with anti-HMGB-1 and anti-Tim-3 antibodies in the co-culture restored the suppressor function of CD8+ Treg cells (Fig. 7B). Tim-3 was indeed capable of binding HMGB-1, as rTim-3Fc chimeric protein co-immunoprecipitated with HMGB-1 present in the supernatants collected from BMDC and BMDC/OT-I cultures (Fig. 7C).
Fig. 7. Tim-3 binding to HMGB-1 controls CD8+ Treg cell suppression independently of Gal-9.
(A) The number of dividing OT-I T cells at D3 was determined when rGal-9 was included in the media of CFSE-labeled naïve Thy1.1+CD8+ OT-I T cells cultured with SIINFEKL-pulsed BMDCs and when these cells were co-cultured with D7 Ad-Ova liver-primed CD8+ Treg cells in the presence of anti-Gal-9 Ab (n = 3 per group). (B) D7 Ad-Ova primed CD8+ Treg cells were isolated from livers, left alone or pre-coated with anti-Tim-3 Ab, and co-cultured with CFSE-labeled naïve Thy1.1+CD8+ OT-I T cells at a 1:1 ratio and SIINKFEKL-pulsed BMDCs. Select wells also contained anti-HMGB-1 Ab in the media during culture. D3 CFSE dilution and number of dividing OT-I T cells and OT-I T cell division index were evaluated (one-way ANOVA/Tukey’s post test; n = 6 per group). (C) Supernatants from media obtained from BMDCs maturing in the presence of rIL-4 and rGM-CSF and from D1 BMDC co-culture with OT-I T cells were incubated with rTim-3Fc chimeric protein for 1 hr, followed by immunoprecipitation with protein A/G and immunoblot analysis with anti-HMGB-1 Ab or anti-human Fc (n = 3 per group). (D) 5×10⁵ naïve Thy1.1+CD8+ OT-I T cells were transferred into D7 Ad-Ova infected mice, which were left untreated or received 300 μg anti-HMGB-1 Ab or anti-Tim-3 Ab IP at D5 and D6 prior to a D7 MCMV-Ova infection. The number of Thy1.1+CD8+ OT-I T cells was assessed in the livers of infected animals at D14 (one-way ANOVA/Tukey’s post test; n = 3–6 per group). (E) PLP-fixed/OCT-frozen liver cross sections from D7 livers were stained with anti-HMGB-1 (red), anti-CD4 (blue), and anti-CD8 (green). Central vein (CV) is indicated (n = 6 per group). Scale bar, 100 μm. (F) 3D orthogonal view representative of PLP-fixed/OCT-frozen Ig LN cross sections from C57BL/6 mice that received CM-DiI-labeled CD8+ Treg cells from D7 infected liver (red) and CFSE-labeled naïve Thy1.1+CD8+ OT-I T cells stained with anti-HMGB-1 (blue) and anti-Tim-3 (green) is shown. Scale bar, 5 μm. Quantification of intracellular HMGB-1+ perinuclear vesicles within uncoated, anti-PD-L1 Ab pre-coated, and anti-Tim-3 Ab pre-coated CD8+ Treg cells was assessed per cell in images (one-way ANOVA/Tukey’s post test; n = 3 per group). Numbers in the histograms represent percentages. Mean ± s.e.m.; *P < 0.05, **P < 0.01, and ***P < 0.001.
During the in vivo virus-induced hepatitis model where Thy1.1+CD8+ OT-I T cells were adoptively transferred into D7 Ad-Ova infected mice prior to MCMV-Ova infection, IP delivery of anti-Tim-3 antibody at D5 and D6 increased the absolute number of Thy1.1+CD8+ OT-I T cells in the livers of mice previously infected with Ad-Ova as before. Consistent with in vitro results, animals that received both anti-HMGB-1 and anti-Tim-3 antibodies IP failed to boost an OT-I T cell response to MCMV-Ova within the liver (Fig. 7D). These results suggest that blockade of HMGB-1 abrogates the enhancement in proliferation after Tim-3 blockade.
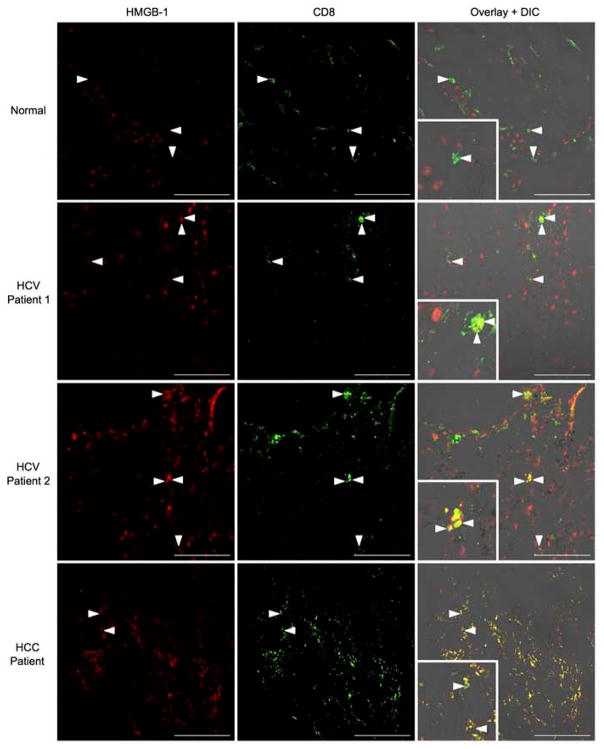
A histological analysis of D7 Ad-Ova infected livers revealed that the CD8+ T cells were exclusively sequestering HMGB-1 in vivo on their surface and cytoplasm (Fig. 7E). Given that DCs are a potent source of HMGB-1 within the lymph node during T cell activation, CD8+ Treg cells may also have sequestered HMGB-1 once transferred and trafficked to the Ig LN of SC infected mice. Indeed, IV CD8+ Treg cells bound HMGB-1 within intracellular vesicles, which co-localized with CD8+ Treg cell Tim-3. Anti-Tim-3 antibody pre-coated IV CD8+ Treg cells were clearly defective in internalizing HMGB-1 (Fig. 7F). In human liver biopsy specimens from chronic HCV and HCC patients, HMGB-1 was also observed to bind the surface of a subpopulation of intrahepatic CD8+ T cells (Fig. 8). These results describe a novel mechanism where Tim-3 on the surface of IV CD8+ Treg cells binds HMGB-1 hampering CD8+ Teff cell proliferation, which have a potential for translation to human liver biology.
Fig. 8. HMGB-1 binds to CD8+ T cells in the livers of chronic HCV and HCC patients.
Acetone-fixed liver cross sections of human biopsies from normal donors, chronic HCV patients, and HCC patients were stained with anti-HMGB-1 (red) and anti-CD8 (green). The inlays depict areas of HMGB-1/CD8 co-localization in HCC/HCV patients (Normal n = 3 per group; HCV n = 5 per group; HCC n = 2 per group). Representative images are displayed. Scale bar, 100 μm.
DISCUSSION
In this report we demonstrate that hepatic viral infection results in the generation and expansion of a novel population of CD8+ Treg cells. Regulatory activity was independent of PD-L1 expression and IL-10 production by the CD8+ Treg cells but was dependent on Tim-3 expression. CD8+ Treg cell Tim-3 bound HMGB-1 preventing CD8+ Teff cell expansion. Given the role of HMGB-1 as a critical stimulus for expansion of CD8+ Teff cells following TCR-engagement, our results suggest a novel mechanism where intrahepatic CD8+ Treg cells limit CD8+ Teff cell expansion via Tim-3-mediated sequestration of HMGB-1.
Previous studies have shown that liver infiltrating CD25+FoxP3+CD4+ Treg cells dampen immune responses to hepatic viral infection (21). FoxP3+CD4+ Treg cells are found in the naïve liver but do not significantly expand after adenovirus infection (data not shown). In chronic HCV infection, Tim-3 is upregulated on CD4+ iTreg cells (22). As a result, Tim-3 binding of HMGB-1 could play a similar role on CD25+FoxP3+CD4+ Treg cells. More research is needed to determine if CD4+ and CD8+ Treg cells use Tim-3 to continuously sequester HMGB-1 released by necrotic hepatocytes and activated APCs during chronic HCV infection. This mechanism could contribute to the transition from acute to chronic infection and/or allow virus to persist during later stages of chronic disease.
The suppressive function of liver-primed CD8+ Treg cells was exerted in an antigen-specific manner, that is recognition of peptide/MHC I complex on the APC by both the CD8+ Treg and Teff cell was necessary and sufficient for Tim-3-mediated suppression. Rangachari et al. establish that Tim-3 signaling is linked to TCR engagement via the Src-family kinase Lck through interaction with HLA-B-associated transcript 3 (Bat3). Gal-9 binding to Tim-3 prevented Bat-3 linkage to active Lck, thus modulating downstream TCR signaling (23). Our results support the notion that suppression of CD8+ Teff cells is dependent on both CD8+ Treg cell TCR recognition of antigen and Tim-3 binding to HMGB-1.
Although blockade of Tim-3 improved OT-I T cell proliferation in an HMGB-1-dependent manner, enhancement in IL-2 and IFN-γ production was only detected in the culture supernatant and was not evident on a per cell basis (data not shown). The elevated pro-inflammatory cytokine production likely reflected enhanced proliferation of responder OT-I cells. To date, HMGB-1 has been shown to improve proliferation of both CD4+ and CD8+ T cells, but enhanced levels of cytokines have only been associated with CD4+ Th1 cell responses (20). It is possible that HMGB-1 only affects proliferation of CD8+ Teff cells. Conversely, the TCR is one of the most complex signaling molecules in nature, having ten ITAM motifs, whereas most receptors utilize two. Guy et al. revealed that different multiplicities of ITAM and TCR signal strength uncouples proliferation and cytokine production. This effect was dependent on TCR affinity for peptide, where superagonists and strong peptides induced proliferation while weak peptides sufficiently led to maximal IL-2 secretion (24). Ovalbumin was used as the model antigen in these experiments, where the OT-I T cells receive a strong TCR signal. Since strength of signal dictates proliferation or cytokine production, we may have masked a role for Tim-3/HMGB-1 in regulating CD8+ Teff cell cytokine production. In the future, it is worth employing another transgenic system where the responder T cells recognize a weaker peptide/MHC I complex. Alternatively, BMDCs could be pulsed with mutated ovalbumin derived peptides providing a suboptimal TCR signal.
Gal-9 and HMGB-1 are both present throughout the course of viral infection of the liver. During antiviral immune responses, including chronic HCV infection, Gal-9 is expressed by a wide variety of cells in response to elevated IFN-γ (25). Apart from activated APCs releasing HMGB-1, it can be passively released by virally lysed, cytolytically killed, hypoxic, and oxidatively stressed hepatocytes (26). Since the binding sites for Gal-9 and HMGB-1 are distally located on Tim-3 mucin and immunoglobulin variable regions, respectively, we cannot rule out the possibility of simultaneous recognition of both ligands. In this context, the concentrations of Gal-9 and HMGB-1 along with their different avidities for Tim-3 during viral infection and cancer could balance the adaptive immune response in multiple ways. Prior research is limited because the RMT3-23 clone of anti-Tim-3 antibody is effective at blocking both Gal-9 and HMGB-1 binding to Tim-3 (17,27).
Approximately 600 million people worldwide are in danger of developing chronic liver disease due to HBV/HCV, and only a subset of these patients respond to IFN-α/ribavirin therapy (3). Simultaneous blockade of the IL-10, PD-1/PD-L1, and Tim-3 inhibitory pathways has potential clinical efficacy. However, elevated serum HMGB-1 during HCV infection directly correlates with liver disease progression (28). HMGB-1 sequestration by Treg cell Tim-3 may therefore not be sufficient to suppress Teff cells under conditions of extensive liver injury and HMGB-1 release. We herein report that HMGB-1 staining co-localizes to the surface of CD8+ T cell subpopulations found in chronic HCV and HCC liver biopsies; therefore, a role for HMGB-1 in advanced human diseases remains to be elucidated. Thus, disease progression, signaling pathway integration, and ligand concentration, accessibility, and avidity for receptors must all be considered in the design of immunotherapeutic strategies.
In summary, these data describe a novel mechanism where Tim-3 binds HMGB-1 on virus-specific CD8+ Treg cells suppressing the proliferation of CD8+ Teff cells during acute adenovirus infection. This observation provides a framework for future studies of Tim-3, where consideration for ligand access of both Gal-9 and HMGB-1 is warranted. Translation to human liver disease is expected given that a similar population of IL-10-producing, PD-1/PD-L1+Tim-3+CD8+ T cells exists in liver biopsies of chronic HCV patients.
Supplementary Material
Acknowledgments
Financial Support
NIH Grants DK063222, U19 AI083024, and Immunology Training Fellowship T32 AI07496 supported this publication.
After pilot experiments established a CD8+ Treg cell phenotype, Jie Sun at Indiana University kindly aided in optimizing CD8+ T cell co-culture experiments. We also thank Taeg Kim and Hai-Chon Lee of the University of Virginia for their contributions in experimental design. Sun-Sang Sung and the University of Virginia Advanced Microscopy Facility assisted in confocal imaging. Michael Solga and the University of Virginia Flow Cytometry Core Facility contributed to performing and outlining FACS-sorting experiments.
List of Abbreviations
- Ad
adenovirus
- ALT
alanine aminotransferase
- APC
antigen presenting cell
- BMDC
bone marrow-derived dendritic cell
- C LN
celiac lymph node
- D
day
- DAMP
danger associated molecular pattern
- DC
dendritic cell
- FMO
fluorescence minus one
- Gal-9
galectin-9
- GrB
granzyme B
- HBV
hepatitis B virus
- HCC
hepatocellular carcinoma
- HCV
hepatitis C virus
- HMGB-1
high-mobility group box 1
- Ig LN
inguinal lymph node
- IP
intraperitoneal
- IV
intravenous
- MCMV
mouse cytomegalovirus
- PAMP
pathogen associated molecular pattern
- PD-1
programmed death 1
- PD-L1
PD-1 ligand
- PLP
periodate-lysine-paraformaldehyde fixative
- RAGE
receptor for advanced glycation end products
- SC
subcutaneous
- TCR
T cell receptor
- Teff
T effector
- Tim-3
T cell immunoglobulin and mucin 3
- Treg
T regulatory
Footnotes
The authors declared no conflict of interest.
References
- 1.Crispe IN. The Liver as a Lymphoid Organ. Annu Rev Immunol. 2009;27:147–163. doi: 10.1146/annurev.immunol.021908.132629. [DOI] [PubMed] [Google Scholar]
- 2.Lukens JR, Dolina JS, Kim TS, Tacke RS, Hahn YS. Liver is able to activate naïve CD8+ T cells with dysfunctional anti-viral activity in the murine system. PLoS ONE. 2009;4:e7619. doi: 10.1371/journal.pone.0007619. [DOI] [PMC free article] [PubMed] [Google Scholar]
- 3.Callendret B, Walker C. A siege of hepatitis: Immune boost for viral hepatitis. Nat Med. 2011;17:252–253. doi: 10.1038/nm0311-252. [DOI] [PMC free article] [PubMed] [Google Scholar]
- 4.Tiegs G, Lohse AW. Immune tolerance: What is unique about the liver. Journal of Autoimmunity. 2010;34:1–6. doi: 10.1016/j.jaut.2009.08.008. [DOI] [PubMed] [Google Scholar]
- 5.Mills KHG. Regulatory T cells: friend or foe in immunity to infection? Nat Rev Immunol. 2004;4:841–855. doi: 10.1038/nri1485. [DOI] [PubMed] [Google Scholar]
- 6.Takahashi T, Tagami T, Yamazaki S, Uede T, Shimizu J, Sakaguchi N, et al. Immunologic self-tolerance maintained by CD25(+)CD4(+) regulatory T cells constitutively expressing cytotoxic T lymphocyte-associated antigen 4. J Exp Med. 2000;192:303–310. doi: 10.1084/jem.192.2.303. [DOI] [PMC free article] [PubMed] [Google Scholar]
- 7.Strauss L, Bergmann C, Whiteside TL. Human circulating CD4+CD25highFoxp3+ regulatory T cells kill autologous CD8+ but not CD4+ responder cells by Fas-mediated apoptosis. The Journal of Immunology. 2009;182:1469–1480. doi: 10.4049/jimmunol.182.3.1469. [DOI] [PMC free article] [PubMed] [Google Scholar]
- 8.Kim H-J, Wang X, Radfar S, Sproule TJ, Roopenian DC, Cantor H. CD8+ T regulatory cells express the Ly49 Class I MHC receptor and are defective in autoimmune prone B6-Yaa mice. Proc Natl Acad Sci USA. 2011;108:2010–2015. doi: 10.1073/pnas.1018974108. [DOI] [PMC free article] [PubMed] [Google Scholar]
- 9.Salti SM, Hammelev EM, Grewal JL, Reddy ST, Zemple SJ, Grossman WJ, et al. Granzyme B Regulates Antiviral CD8+ T Cell Responses. The Journal of Immunology. 2011;187:6301–6309. doi: 10.4049/jimmunol.1100891. [DOI] [PMC free article] [PubMed] [Google Scholar]
- 10.Kitazawa Y, Fujino M, Wang Q, Kimura H, Azuma M, Kubo M, et al. Involvement of the Programmed Death-1/Programmed Death-1 Ligand Pathway in CD4+CD25+ Regulatory T-Cell Activity to Suppress Alloimmune Responses. Transplantation. 2007;83:774–782. doi: 10.1097/01.tp.0000256293.90270.e8. [DOI] [PubMed] [Google Scholar]
- 11.Blackburn SD, Wherry EJ. IL-10, T cell exhaustion and viral persistence. Trends Microbiol. 2007;15:143–146. doi: 10.1016/j.tim.2007.02.006. [DOI] [PubMed] [Google Scholar]
- 12.Jin H-T, Anderson AC, Tan WG, West EE, Ha S-J, Araki K, et al. Cooperation of Tim-3 and PD-1 in CD8 T-cell exhaustion during chronic viral infection. Proc Natl Acad Sci USA. 2010;107:14733–14738. doi: 10.1073/pnas.1009731107. [DOI] [PMC free article] [PubMed] [Google Scholar]
- 13.Couper KN, Blount DG, Riley EM. IL-10: the master regulator of immunity to infection. J Immunol. 2008;180:5771–5777. doi: 10.4049/jimmunol.180.9.5771. [DOI] [PubMed] [Google Scholar]
- 14.Fife BT, Pauken KE, Eagar TN, Obu T, Wu J, Tang Q, et al. Interactions between PD-1 and PD-L1 promote tolerance by blocking the TCR-induced stop signal. Nat Immunol. 2009;10:1185–1192. doi: 10.1038/ni.1790. [DOI] [PMC free article] [PubMed] [Google Scholar]
- 15.Golden-Mason L, Palmer BE, Kassam N, Townshend-Bulson L, Livingston S, McMahon BJ, et al. Negative Immune Regulator Tim-3 Is Overexpressed on T Cells in Hepatitis C Virus Infection and Its Blockade Rescues Dysfunctional CD4+ and CD8+ T Cells. Journal of Virology. 2009;83:9122–9130. doi: 10.1128/JVI.00639-09. [DOI] [PMC free article] [PubMed] [Google Scholar]
- 16.Cao E, Zang X, Ramagopal UA, Mukhopadhaya A, Fedorov A, Fedorov E, et al. T Cell Immunoglobulin Mucin-3 Crystal Structure Reveals a Galectin-9-Independent Ligand-Binding Surface. Immunity. 2007;26:311–321. doi: 10.1016/j.immuni.2007.01.016. [DOI] [PubMed] [Google Scholar]
- 17.Chiba S, Baghdadi M, Akiba H, Yoshiyama H, Kinoshita I, Dosaka-Akita H, et al. Tumor-infiltrating DCs suppress nucleic acid–mediated innate immune responses through interactions between the receptor TIM-3 and the alarmin HMGB1. Nature Publishing Group. 2012;13:832–842. doi: 10.1038/ni.2376. [DOI] [PMC free article] [PubMed] [Google Scholar]
- 18.Lotze MT, Tracey KJ. High-mobility group box 1 protein (HMGB1): nuclear weapon in the immune arsenal. Nat Rev Immunol. 2005;5:331–342. doi: 10.1038/nri1594. [DOI] [PubMed] [Google Scholar]
- 19.Dumitriu IE, Baruah P, Valentinis B, Voll RE, Herrmann M, Nawroth PP, et al. Release of high mobility group box 1 by dendritic cells controls T cell activation via the receptor for advanced glycation end products. J Immunol. 2005;174:7506–7515. doi: 10.4049/jimmunol.174.12.7506. [DOI] [PubMed] [Google Scholar]
- 20.Sundberg E, Fasth AER, Palmblad K, Harris HE, Andersson U. High mobility group box chromosomal protein 1 acts as a proliferation signal for activated T lymphocytes. Immunobiology. 2009;214:303–309. doi: 10.1016/j.imbio.2008.09.006. [DOI] [PubMed] [Google Scholar]
- 21.Xu D, Fu J, Jin L, Zhang H, Zhou C, Zou Z, et al. Circulating and liver resident CD4+CD25+ regulatory T cells actively influence the antiviral immune response and disease progression in patients with hepatitis B. J Immunol. 2006;177:739–747. doi: 10.4049/jimmunol.177.1.739. [DOI] [PubMed] [Google Scholar]
- 22.Moorman JP, Wang JM, Zhang Y, Ji XJ, Ma CJ, Wu XY, et al. Tim-3 Pathway Controls Regulatory and Effector T Cell Balance during Hepatitis C Virus Infection. The Journal of Immunology. 2012 doi: 10.4049/jimmunol.1200162. [DOI] [PMC free article] [PubMed] [Google Scholar]
- 23.Rangachari M, Zhu C, Sakuishi K, Xiao S, Karman J, Chen A, et al. Bat3 promotes T cell responses and autoimmunity by repressing Tim-3–mediated cell death and exhaustion. Nat Med. 2012;18:1394–1400. doi: 10.1038/nm.2871. [DOI] [PMC free article] [PubMed] [Google Scholar]
- 24.Guy CS, Vignali KM, Temirov J, Bettini ML, Overacre AE, Smeltzer M, et al. Distinct TCR signaling pathways drive proliferation and cytokine production in T cells. Nature Publishing Group. 2013;14:262–270. doi: 10.1038/ni.2538. [DOI] [PMC free article] [PubMed] [Google Scholar]
- 25.Rodriguez-Manzanet R, DeKruyff R, Kuchroo VK, Umetsu DT. The costimulatory role of TIM molecules. Immunol Rev. 2009;229:259–270. doi: 10.1111/j.1600-065X.2009.00772.x. [DOI] [PMC free article] [PubMed] [Google Scholar]
- 26.Klune J, Dhupar R. HMGB1: Endogenous Danger Signaling. Mol Med. 2008;14:1. doi: 10.2119/2008-00034.Klune. [DOI] [PMC free article] [PubMed] [Google Scholar]
- 27.Kanzaki M, Wada J, Sugiyama K, Nakatsuka A, Teshigawara S, Murakami K, et al. Galectin-9 and T Cell Immunoglobulin Mucin-3 Pathway Is a Therapeutic Target for Type 1 Diabetes. Endocrinology. 2012;153:612–620. doi: 10.1210/en.2011-1579. [DOI] [PubMed] [Google Scholar]
- 28.Jung JH, Park JH, Jee MH, Keum SJ, Cho MS, Yoon SK, et al. Hepatitis C Virus Infection Is Blocked by HMGB1 Released from Virus-Infected Cells. Journal of Virology. 2011;85:9359–9368. doi: 10.1128/JVI.00682-11. [DOI] [PMC free article] [PubMed] [Google Scholar]
Associated Data
This section collects any data citations, data availability statements, or supplementary materials included in this article.


