
Fig. 3. eGFP+CD8+ Treg cells are more potent suppressors compared to eGFP−CD8+ Treg cells from IL-10 transcriptional reporter mice and display some canonical Treg markers.
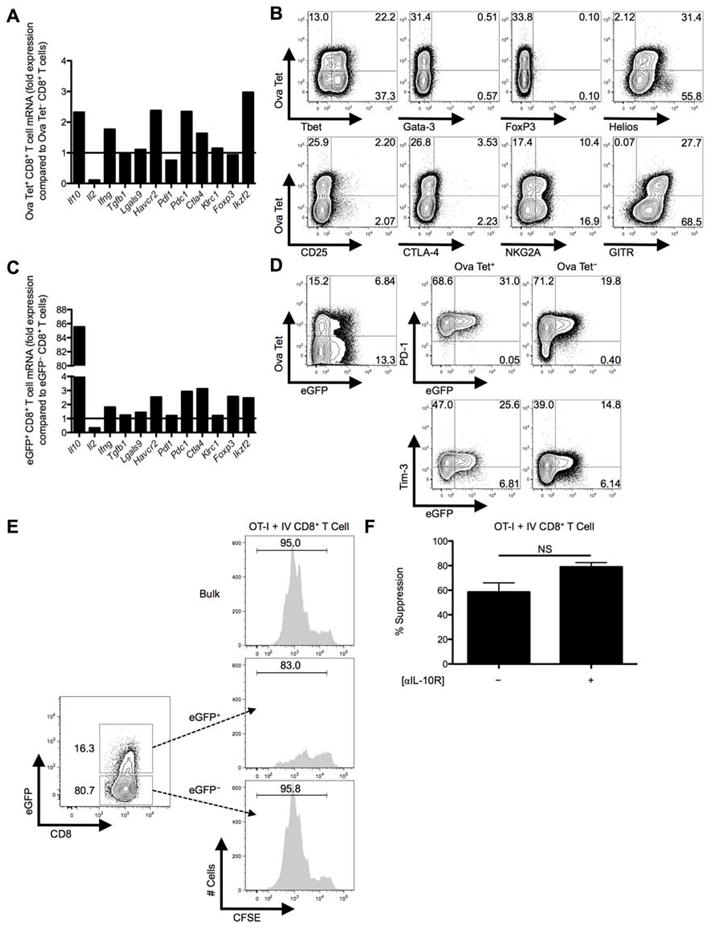
C57BL/6 mice were IV infected with 2.5×10⁷ IU Ad-Ova, D7 liver mononuclear cells were isolated, and total RNA was collected from FACS-sorted Ova Tet+ and Ova Tet−CD8+ Treg cells. (A) Il10 (IL-10), Il2 (IL-2), Ifng (IFN-γ), Tgfb (TGF-β), Lgals9 (Gal-9), Havcr2 (Tim-3), Pdl1 (PD-L1), Pdc1 (PD-1), Ctla4 (CTLA-4), Klrc1 (NKG2A), Foxp3 (FoxP3), and Ikzf2 (Helios) mRNA was measured by Q-PCR. (B) Expression of intranuclear/cellular Tbet/Gata-3/FoxP3/Helios, and surface CD25/CTLA-4/NKG2A/GITR was determined on CD8+ Treg cells from the livers of IV infected mice. (C) Similarly, transcript from FACS-sorted eGFP+CD8+ Treg cells was compared to that of eGFP−CD8+ Treg cells from D7 IV infected Vert-X mice. (D) PD-1 and Tim-3 surface expression along the eGFP profile was separately assessed on Ova Tet+ and Ova Tet−CD8+ Treg cells (n = 3 per group). (E) Representative in vitro suppression assays from bulk CD8+ Treg cells and FACS-sorted eGFP+CD8+ Treg cells or eGFP−CD8+ Treg cells from D7 Ad-Ova IV infected C57BL/6 and Vert-X mice, respectively, co-cultured with CFSE-labeled naïve Thy1.1+CD8+ OT-I T cells at a 1:1 ratio are depicted (n = 3 per group). (F) D3 percent suppression by D7 Ad-Ova liver-primed CD8+ Treg cells during co-culture with CFSE-labeled naïve Thy1.1+CD8+ OT-I T cells at a 1:1 ratio and SIINKFEKL-pulsed BMDCs is displayed. Select wells also contained anti-IL-10R Ab in the media during culture (n = 3 per group). Numbers in the histograms and scatter plots represent percentages.