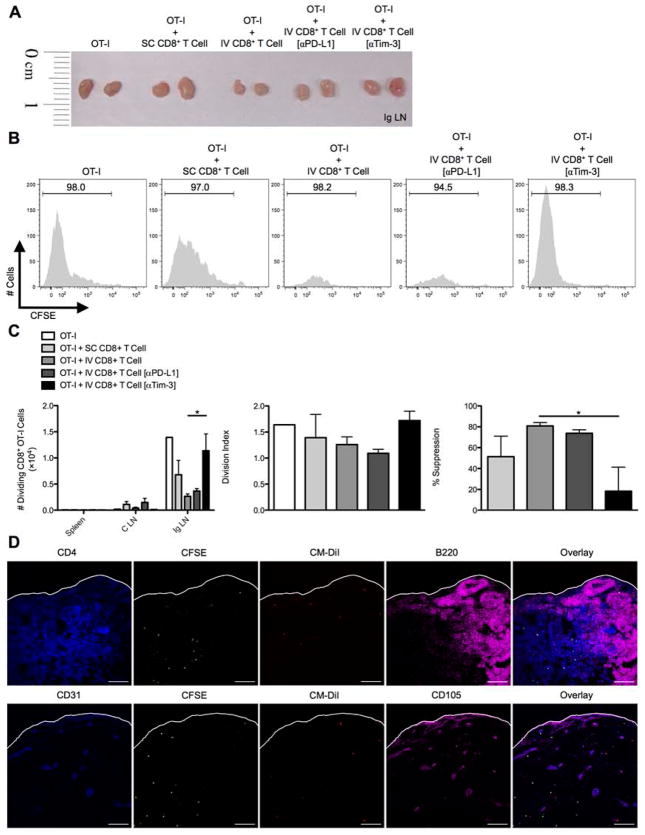
Fig. 6. In vivo CD8+ Treg cell suppression of SC-primed OT-I cells entering draining lymph nodes is regulated by Tim-3.
C57BL/6 mice were SC or IV infected with 2.5×10⁷ IU Ad-Ova, and bulk CD8+ T cells were isolated from D7 SC spleens and IV livers. D7 CD8+ Treg cells from IV infected livers were left alone or pre-coated with anti-PD-L1 Ab or anti-Tim-3 Ab. CFSE-labeled naïve Thy1.1+CD8+ OT-I T cells were adoptively transferred alone or in combination with CD8+ T cells from infected spleens and livers at a 1:2 ratio, respectively, into naïve C57BL/6 mice. Shortly thereafter, these recipient mice were SC infected. At D3 post-infection, the spleens, celiac lymph nodes (C LN), and (A and B) inguinal lymph nodes (Ig LN) were harvested, and (C) the number of dividing OT-I T cells was determined in each organ. The division index and percent suppression of OT-I T cells in the Ig LN is displayed (one-way ANOVA/Tukey’s post test; n = 3–6 per group). (D) CM-DiI-labeled CD8+ Treg cells from D7 IV infected liver (red) and CFSE-labeled naïve Thy1.1+CD8+ OT-I T cells (green) were transferred in a similar experiment and Ig LNs were harvested at D2 SC post-infection. PLP-fixed/OCT-frozen Ig LN cross sections were stained with anti-CD4 (blue-upper panel), anti-CD31 (blue-lower panel), anti-B220 (magenta-upper panel), and CD105 (magenta-lower panel) (n = 3 per group). Scale bar, 100 μm. Numbers in the histograms represent percentages. Mean ± s.e.m.; *P < 0.05.

