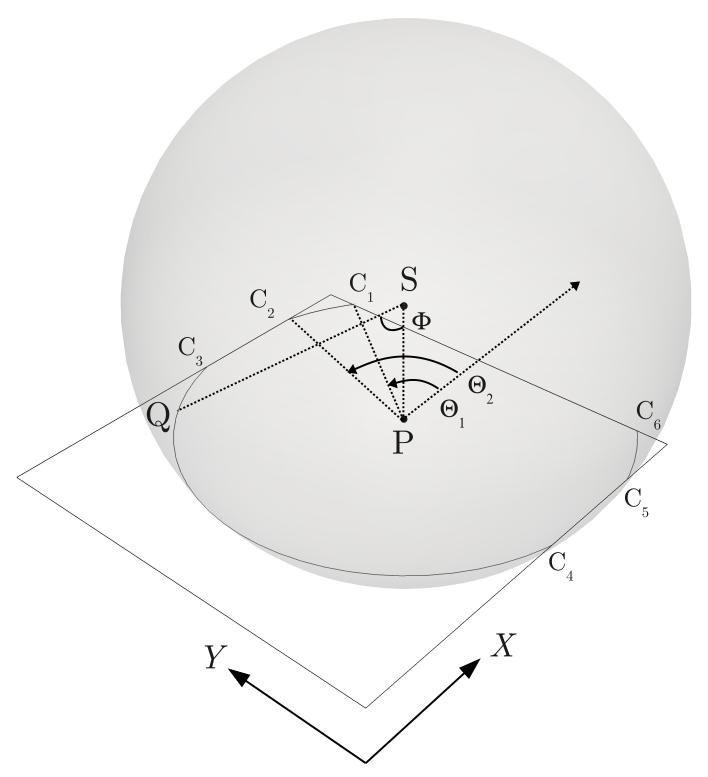
Figure A.1.
The schematic illustration of the method of calculating the semi-analytical SIR. The square at the center of the figure represents the transducer element face. X and Y denote the local coordinate system for the transducer element of interest. S denotes the point photoacoustic source. P denotes the projection of S on the transducer face. The gray spherical shell represents the wavefront at time t. represent the intersections of the wavefront and the edges of the transducer face. Θ1 and Θ2 denote the angle of the radius PC1 and PC2, respectively, measured from the positive X direction. Let Q be an arbitrary point on the intersection arcs. ∠QSP is denoted by Φ.

