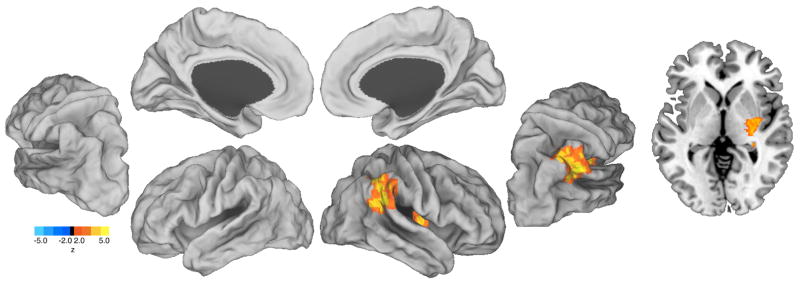
Figure 2.

Group map for execution vs. rest contrast correlated with SBSoD scores. Left, partially inflated views of left and right hemispheres showing activation in right temporal parietal junction (TPJ) corresponds with higher SBSoD scores. Right, an axial slice through MNI z=0. Color scale; Red: regions positively related to SBSoD scores, blue: regions negatively related to SBSoD scores.
