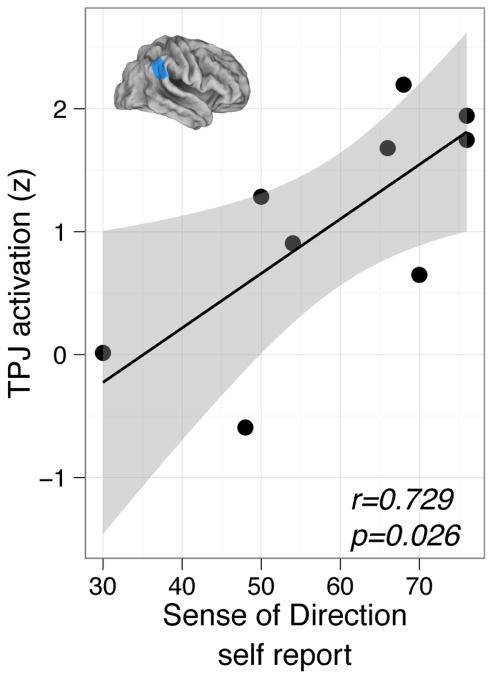
Figure 3.
TPJ activation for execution vs. rest correlates to individual SBSoD scores. A spherical region of interest (5 mm radius) was drawn at the coordinate x=51, y=−54, z=27 (Saxe and Kanwisher, 2003). BOLD activation for the execution vs. rest comparison was converted into z-scores and plotted against individual SBSoD scores. Black line: best linear fit, gray bands 95% confidence interval on linear fit.

