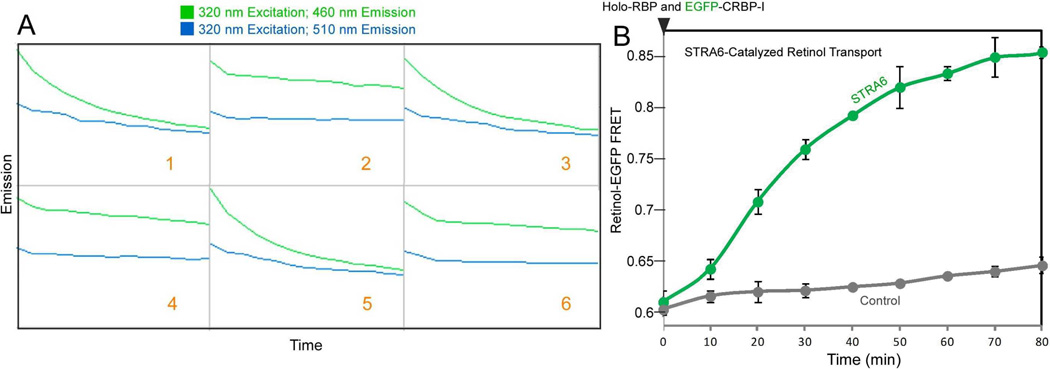
Figure 3.
Real-time monitoring of STRA6-catalyzed retinol transport from holo-RBP to CRBP-I. A. An example of the raw data file that monitors the FRET between retinol and EGFP as shown on the Omega Data Analysis software. At 0 min, holo-RBP is added to the reactions containing STRA6 membrane (reactions 1, 3, and 5) or control membrane with EGFP-CRBP-I to initiate the reactions (reactions 2, 4, and 6). Simultaneous duel emission measurements for excitation at 320 nm revealed the green trace as the 460-10 emission time course and the blue trace as the 510-10 emission time course. B. The final calculated FRET signals for reactions shown in A. The FRET signals were calculated according to the methods in step 3.6.

