Fig. 2.
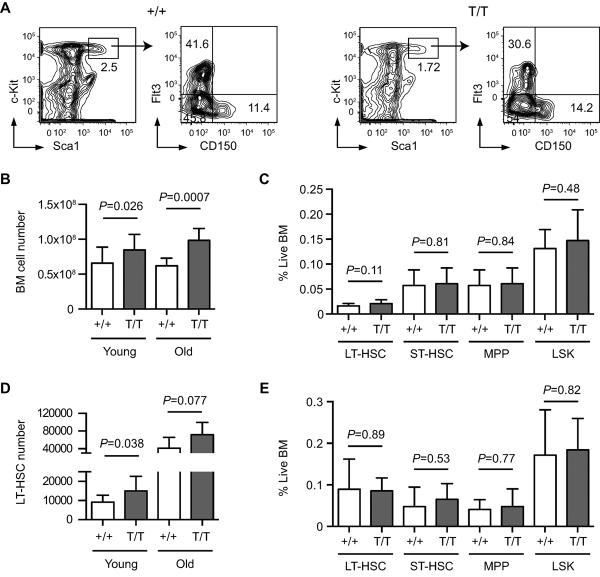
Increased bone marrow (BM) cellularity and expanded long-term hematopoietic stem cell (LT-HSC) population in Smurf2-deficient mice. (A) Representative flow cytometry analysis of HSCs in BM of 2-month old wild-type (+/+) and Smurf2T/T (T/T) mice. Live lineage negative (Lin−) cells are gated and displayed for staining of Sca1 and c-Kit (left panels). LSK (Lin−Sca1+c-kit++) population is gated and displayed for staining of CD150 and Flt3 (right panels). LT-HSCs are defined as Lin−Sca1+c-kit++CD150+Flt3−, while Lin−Sca1+ckit++CD150−Flt3− and Lin−Sca1+c-kit++CD150−Flt3+ are used to enumerate short-term HSCs (ST-HSCs) and multi-potent progenitors (MPPs), respectively. (B) Average live BM cell numbers in young (2-month, N=16) and old (24 to 30-month, N=7) mice. (C) Frequencies of LT-HSC, ST-HSCs, MPP and LSK cells as percent of live BM cells in young (2-month old, N=11) mice. (D) Average LT-HSC numbers in young (2-month, N=11) and old (24 to 30-month, N=6) mice. (E) Frequencies of LT-HSC, ST-HSCs, MPP and LSK cells as percent of live BM cells in old (24 to 30-month, N=6) mice. Error bars are SD and Student's t-test is used for statistical analysis.

