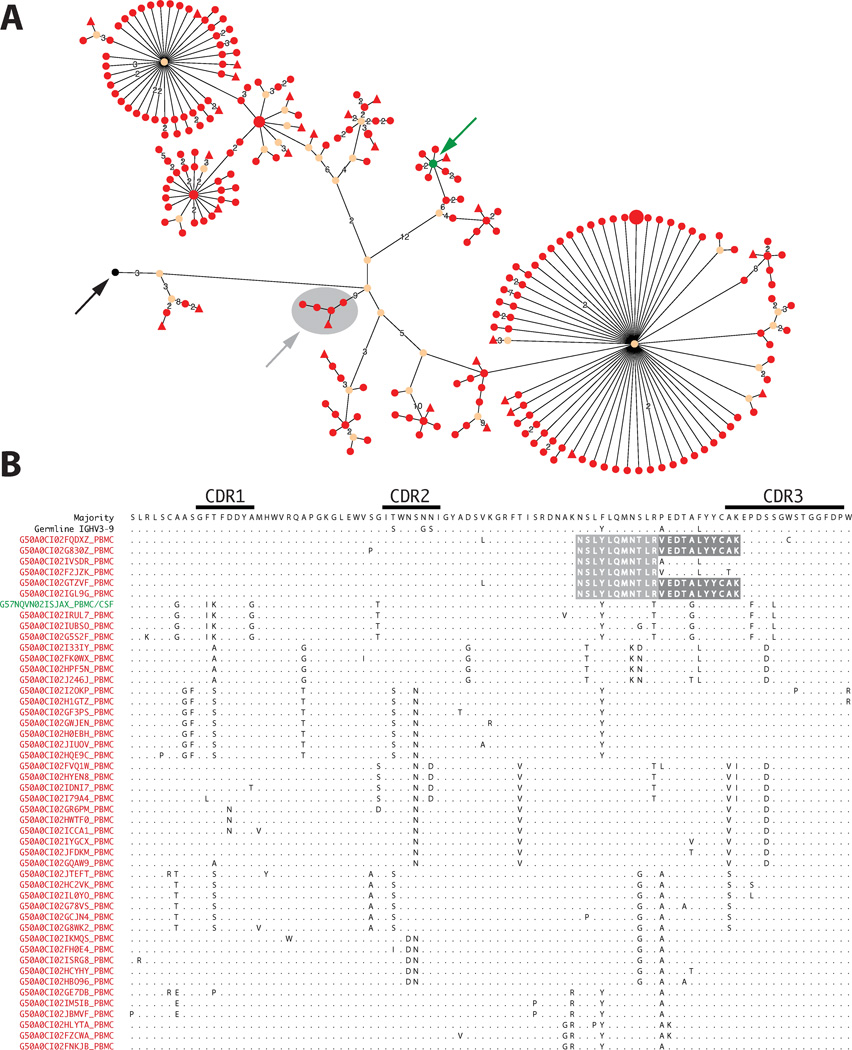
Figure 6. B cell clusters participating in OCB production undergo immune stimulation in the periphery.
Lineage tree (organic layout, A) and alignment of representative IgG-VH amino acid sequences (B) from patient MS-5 are shown. Germline node (black arrow), node comprised of CSF and PBMC IgG-VH (green arrow), and PB-derived sub-cluster identified by OCB peptide-searches (gray arrow) are indicated. In the alignment, matched OCB peptides are shaded in gray; IgG-VH is derived from IGHV3–9 germline segment. Only representative IgG-VH are shown. Organic layout was chosen over hierarchic layout because the latter generates very extensive horizontal images. For additional information please refer to legends of Figures 4 and 5.

