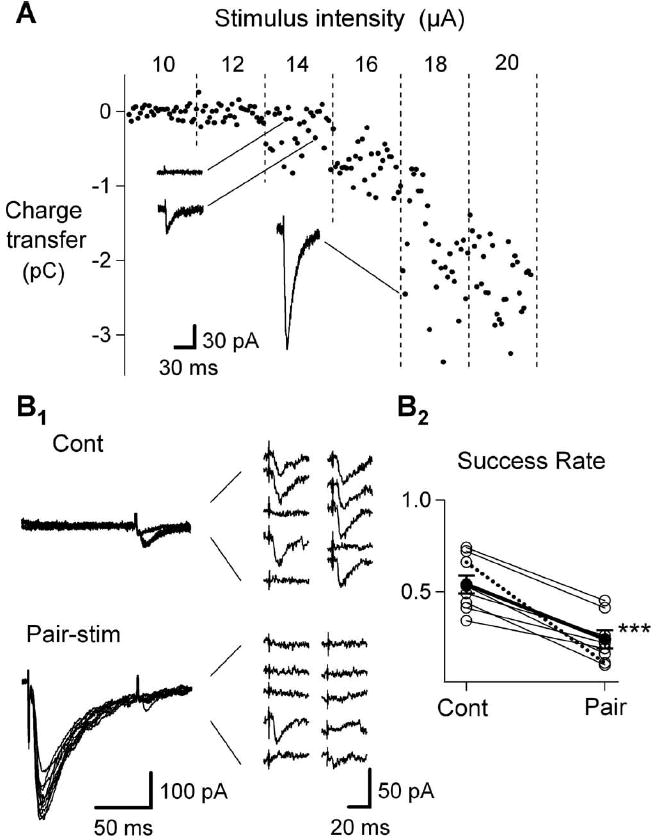
Figure 6.

Recording and analysis of meIPSCs. A, To determine an appropriate stimulus intensity to elicit meIPSCs, a set of evoked IPSCs is activated by titrating stimulus intensities (administered through a patch electrode) to find small all-or-none events. This titration is illustrated as an increase in the charge transfer of each event (●) from failures at 10 and 12 μA, to no failures and predominantly large events (>100 pA; inset) at stimulus intensities >16 μA. Within a narrow range of stimulus intensities, in this case 14 μA, a mixture of failures and small (30 pA; inset) all-or-none events characteristic of meIPSCs are generated. B1, B2 To determine that the meIPSC response is from a synapse activated during the moderate stimulus protocol (driven by an alternate large bipolar stimulating electrode), the meIPSC was preceded 100 ms by the eIPSC (Pair-stim) as described in Materials and Methods, and a change in success rate (compared with meIPSC stimuli alone; Cont) was assessed to determine whether the two stimuli interacted. Ten control responses and paired stimuli are overlayed and expanded in B1 and clearly show a decrease in successful responses in the pairing protocol. B2, This was true for each cell used in the experiments in Figure 7 (thick line is averaged effect for 8 cells; dotted line shows cell in B1). ***p < 0.0003.
