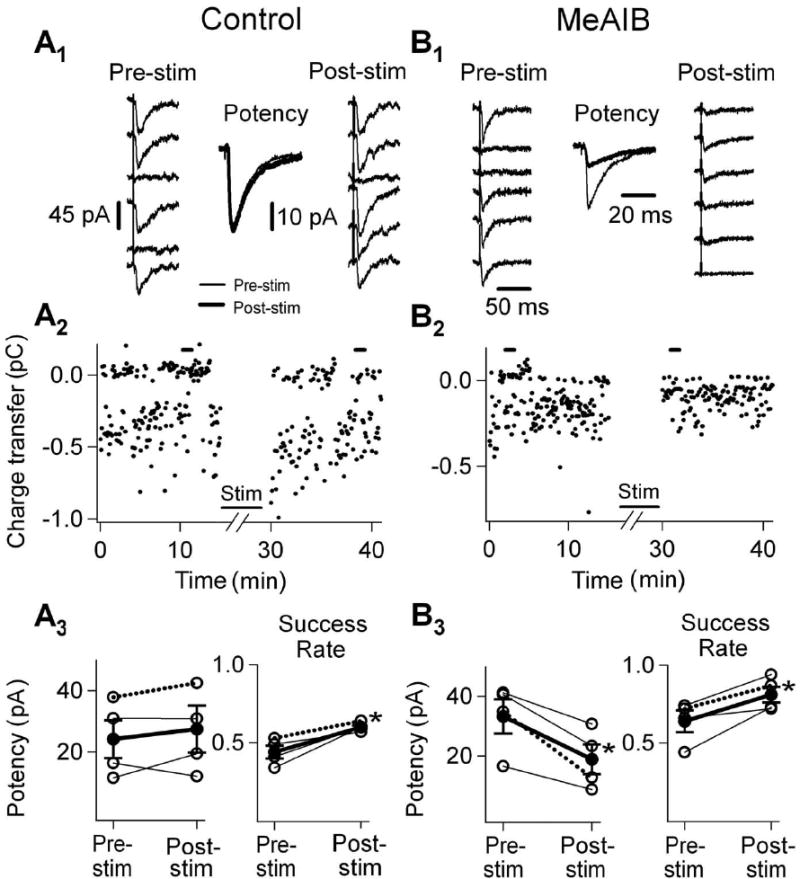
Figure 7.

meIPSCs are sensitive to disruption of the glutamate-glutamine cycle by MeAIB. A1, Consistent with an increase in eIPSC size caused by an increase in probability of release, meIPSCs under control conditions showed no change in potency and a reduction in failures after the burst stimulation protocol. This is illustrated by the lack of change comparing the events evoked preceding the moderate stimulation (Pre-stim; left) to events after the stimulation (Post-stim; right), and by a decrease in the number of failures post-stim (right). The inset (potency) depicts the average potency (event size excluding failures) before (thin line; mean of 91 events) and after (thick line; 102 event) stimulation. A2 plots the event area versus stimulus time for the cell depicted in A1. Note that events are all-or-none and that there is no change in event area for successes after stimulation but a decrease in failures (evident as a decrease in 0 pC events). A3, Plot of change in potency and success rate of individual cells (n = 4) before and after the burst stimulation protocol. Average effect is plotted by the thick line, ± SEM. Note that there is no change in potency but a significant increase in success rate (decreased failures; p < 0.03) after stimulation. B1, Consistent with a decrease in eIPSC size because of a decrease in GABA release, meIPSCs under 5 mm MeAIB-exposed conditions exhibited a decrease in potency (mean of 128 events pre-stim and 149 events post-stim) and an increased probability of release after the burst stimulation protocol. This is illustrated by the reductions evident comparing the events evoked preceding the moderate stimulation (Pre-stim; left) to events after the stimulation (Post-stim; right), and by a decrease in the number of failures post-stim (right). The inset (potency) depicts the average potency (event size excluding failures) before (thin line) and after (thick line) stimulation protocol. B2 plots the event area versus stimulus time for the cell depicted in B1. Note that events are all-or-none and that there is a reduction in event area for successes after stimulation and a decrease in failures (evident as a decrease in 0 pC events). B3, Plot of change in potency and success rate of individual cells (n = 4) before and after the burst stimulation protocol. Average effect is plotted by the thick line, ± SEM. Note that there is a significant decrease in potency ( p < 0.03) and a significant increase in success rate (decreased failures; p < 0.04) after stimulation.
