
Figure 6. Scatter plots showing correlation coefficient and p-values between gene similarity matrix and structural connectivity, fiber distance and Euclidean distance between gene points.
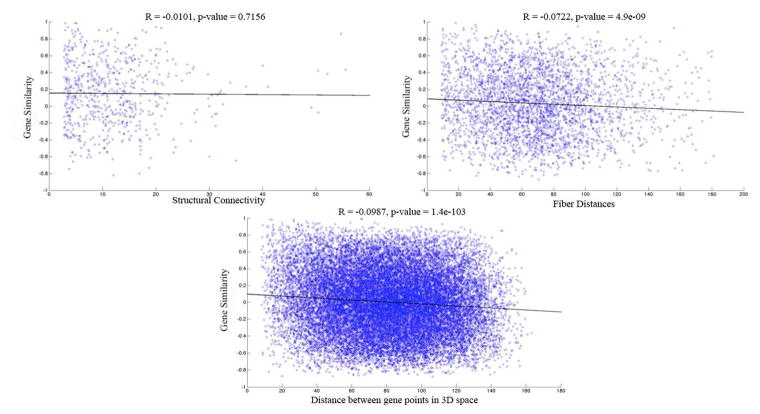
(A) No correlation is found between the structural connectivity matrix obtained from tractography and the gene correlation matrix (B) A negative correlation coefficient of 0.0722 with a significant p-value =0.001 < 0.05 is found between the square matrix of fiber distances and the gene correlation matrix (C) When the actual Euclidean distance between the gene points in 3D space is taken, a negative correlation of 0.0987 is found with the gene similarity matrix. However, small p-values are probably occurring because of the large number of points in the comparison and hence these results may not indicate a true underlying relationship.