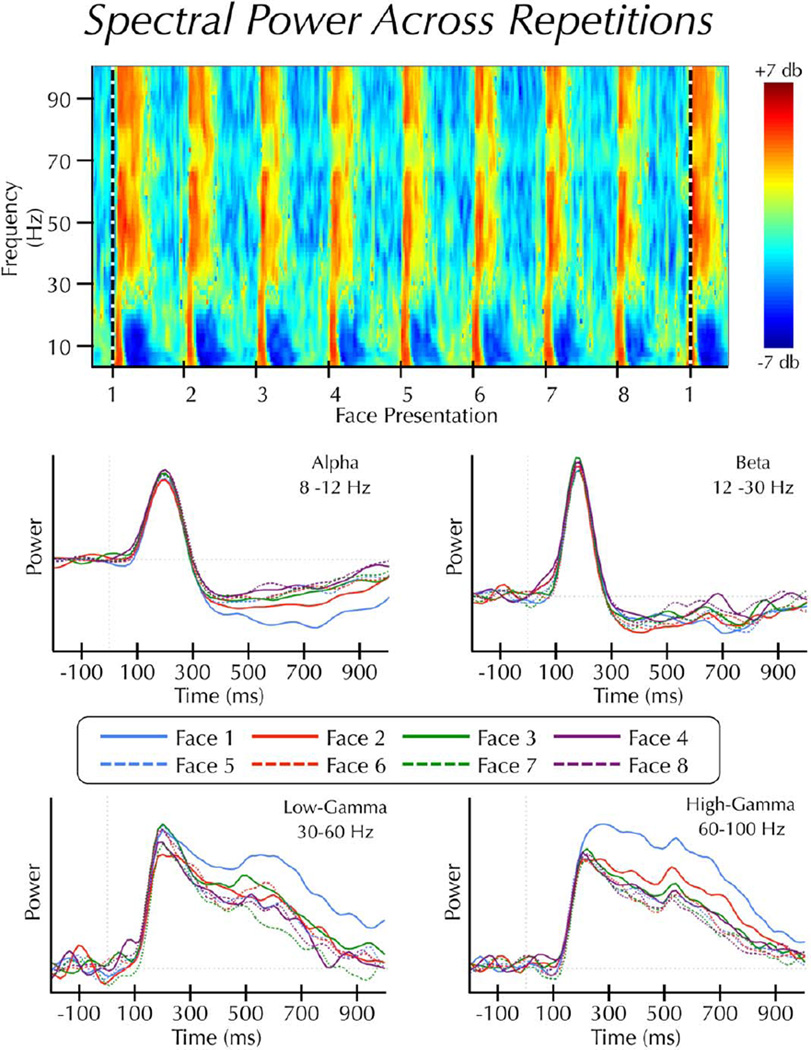
Figure 2.
Spectral power across repetitions. (Top panel) Average time-frequency results displayed as log power changes (db) from a 3 s pre-block baseline epoch. Face presentations are separated by 2 s. The horizontal dashed line indicates the start of a new face identity set. Note: this panel is for illustrative purposes only. Statistical analyses were not performed on spectral estimates relative to a pre-block baseline epoch. (Bottom panel) Average power estimates across the first 1 s of each trial within the alpha, beta, low-gamma, and high-gamma bands. Note: this figure displays continuous power changes over time, whereas the analysis was performed on area under the curve estimates from these waveforms.

