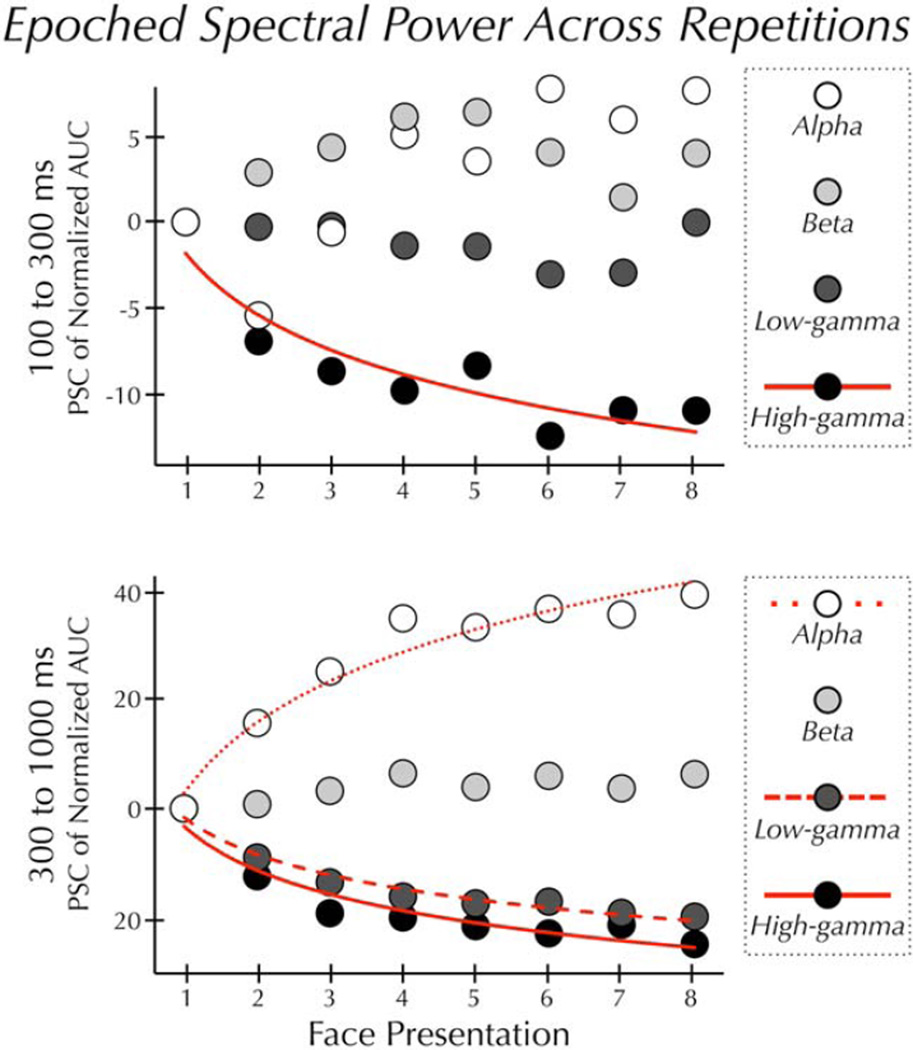
Figure 3.
Epoched spectral power across repetitions. Mean power at each of eight sequential presentations of the same face. Prior to plotting, the AUC data were normalized between 0 and 1 (see Methods). Within each frequency band, AUC at each trial is plotted relative to the AUC induced by the first presentation of the face. (Top panel) In the early epoch power in the high-gamma band varied significantly and was best described by a decreasing power-law function (solid line). Power in the alpha, beta, and low-gamma bands did not significantly vary across repetitions. (Bottom panel) In the late epoch power in the alpha band varied significantly and was best described by an increasing logarithmic function (dotted line). Power in the low- and high-gamma bands also varied significantly. These changes in power were best described by a decreasing power-law function (dashed and solid line). Power in the beta band did not significantly vary across repetitions.

