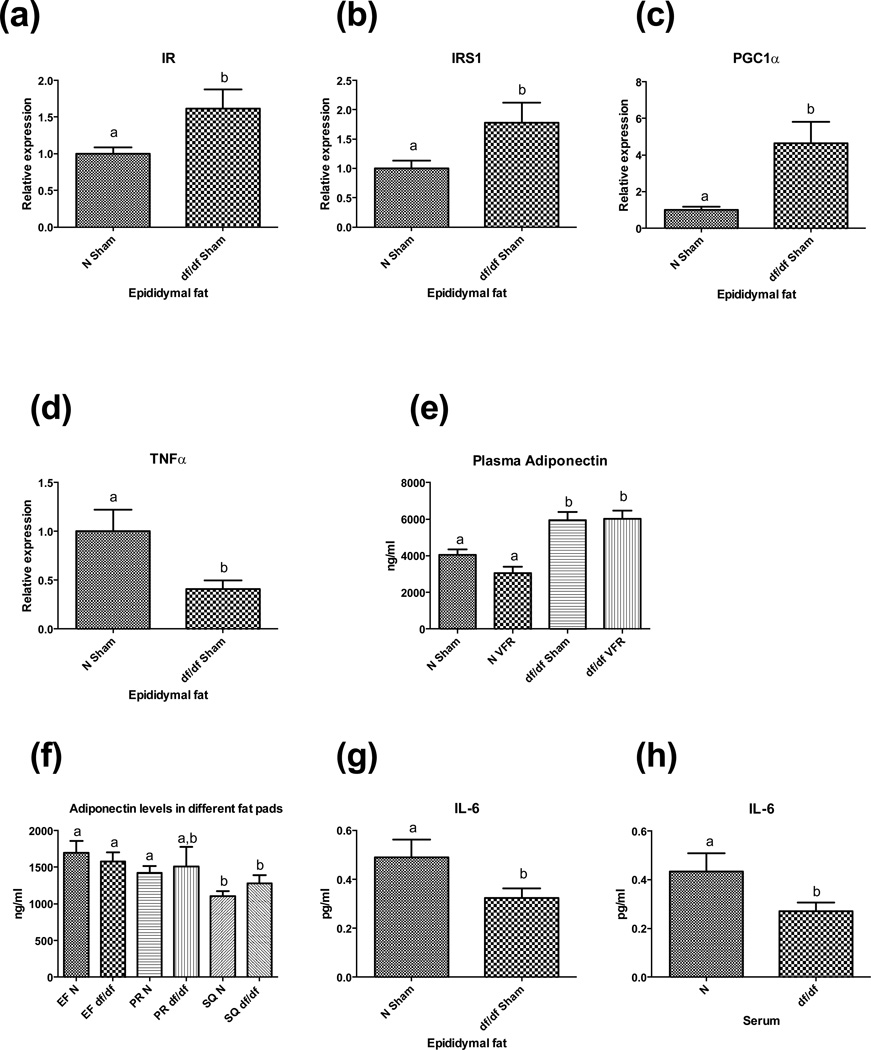
Figure 4.
Gene expression levels in epididymal fat and adipokines levels in circulation. (a, b, c) Expression of genes promoting insulin sensitivity in epididymal fat. (d) Expression of TNFα transcript in epididymal fat. (e, f) Adiponectin levels in circulation and in different fat pads. (g, h) IL-6 protein levels in EF and serum. Different letters represent statistical significance (p < 0.05)

