
Figure1. Quantification of extracellular acetate and ethanol during chronological aging.
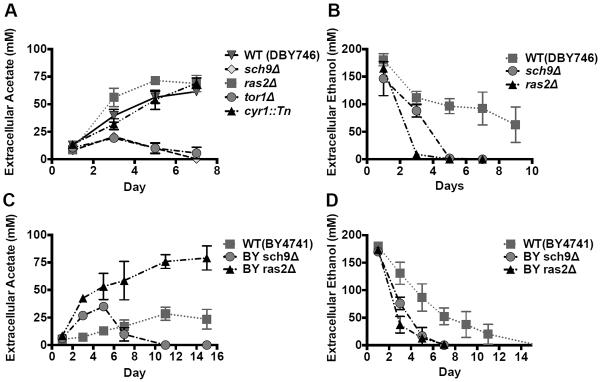
Extracellular acetate (A) and ethanol (B) concentrations of wild type, sch9Δ, ras2Δ, tor1Δ and cyr1::Tn mutants in DBY746 background on days 1, 3, 5 and 7. Data are presented as mean ± SEM (n=3–7). Extracellular acetate (C) and ethanol (D) concentrations of wild type, sch9Δ, ras2Δ mutants in BY4741 background (n=3–6).