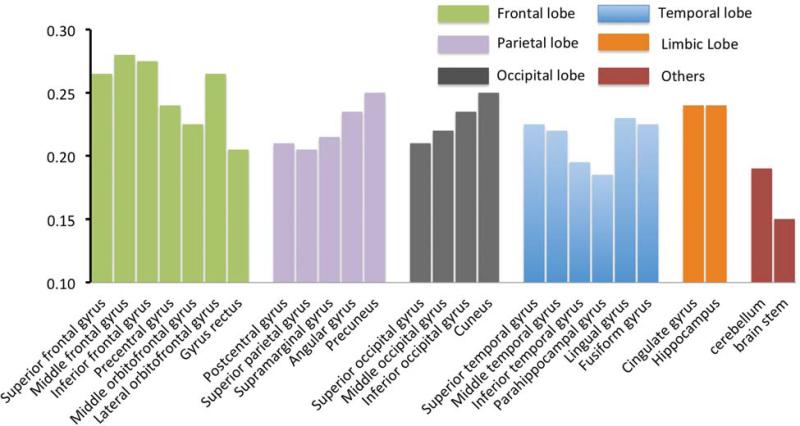
Fig. 4.
Summary of the age-related change rate for different structures. The structures were clustered into different colors according to lobes. Structures in the frontal lobe showed the highest age-related absolute SUV change rate than structures in other lobes, although some structures (such as parahippocampal gyrus in the temporal lobe and gyrus rectus in the frontal lobe) stood out within the same lobe.

