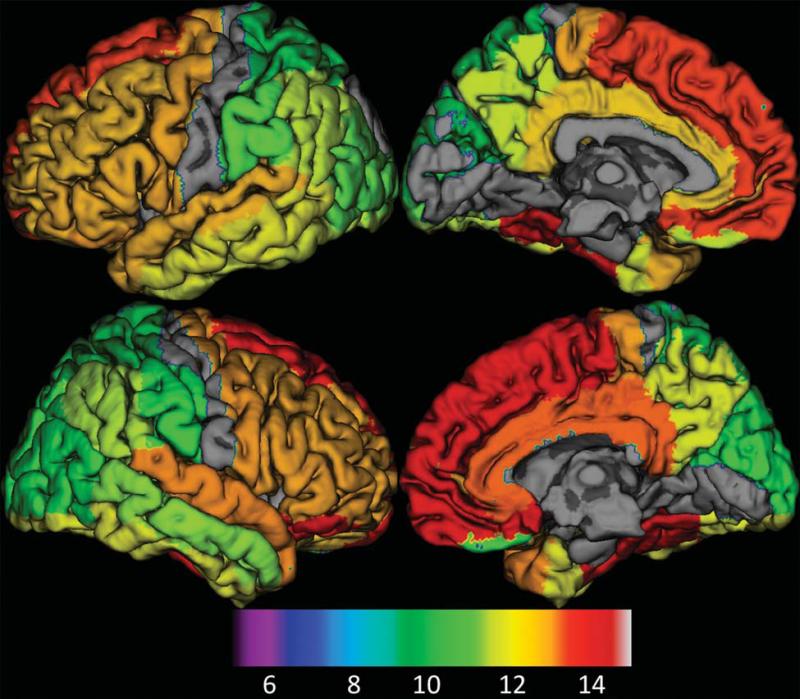
Fig. 5.
The surface rendering of normalized SUV peak ages overlaid on the atlas for individual structures. Peak ages were overlaid on a surface based representation of the MNI canonical brain using the SPM□surfrend toolbox (written by I. Kahn; spmsurfrend.sourceforge.net) and NeuroLens (www.neurolens.org), separately for lateral (left column) and medial views (right column) in the left (upper row) and right hemispheres (lower row). The structures with no significant relationship with age were excluded. The peak ages were scaled into colors from green to yellow, and red (bottom color bar). The peak age is increased from posterior to anterior and from superior to inferior, which aligns well with brain maturation pattern found from brain anatomic studies.

