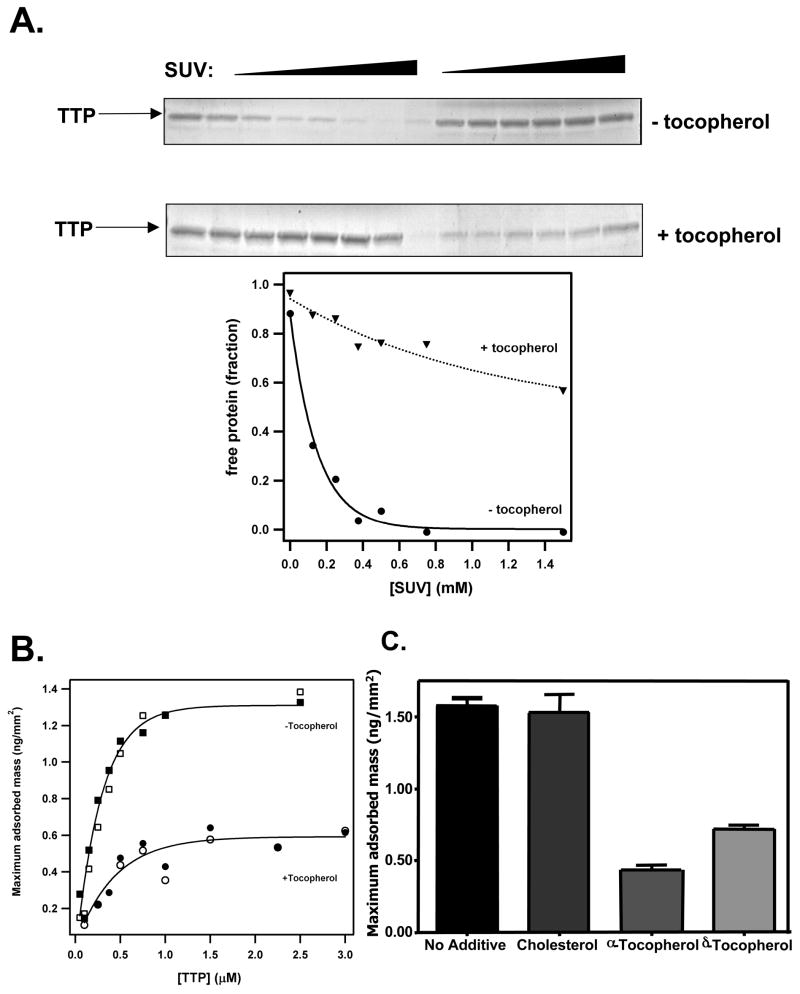
Figure 3. Effect of vitamin E on the interaction between αTTP and membranes.
A) Filtration experiments were performed as in Figure 2A, in the presence or absence of RRR-α-tocopherol (6 mol %). Shown is a representative of 3 independent experiments. B) DPI. Shown is the specific mass of αTTP adsorbed to immobilized phospholipid layers containing (or not) RRR-α-tocopherol (6 mol%) at different protein concentrations. C) Maximum specific adsorbed mass observed with 500 nM αTTP flowed over adsorbed phospholipids containing 6 mol% of either cholesterol, RRR-α-tocopherol, or RRR-δ-tocopherol.

