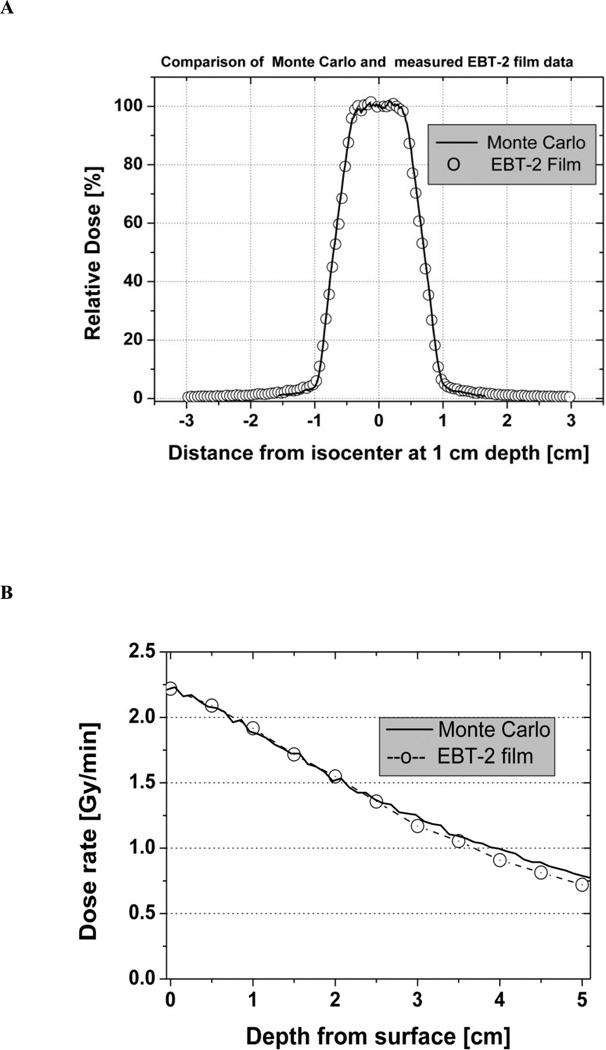
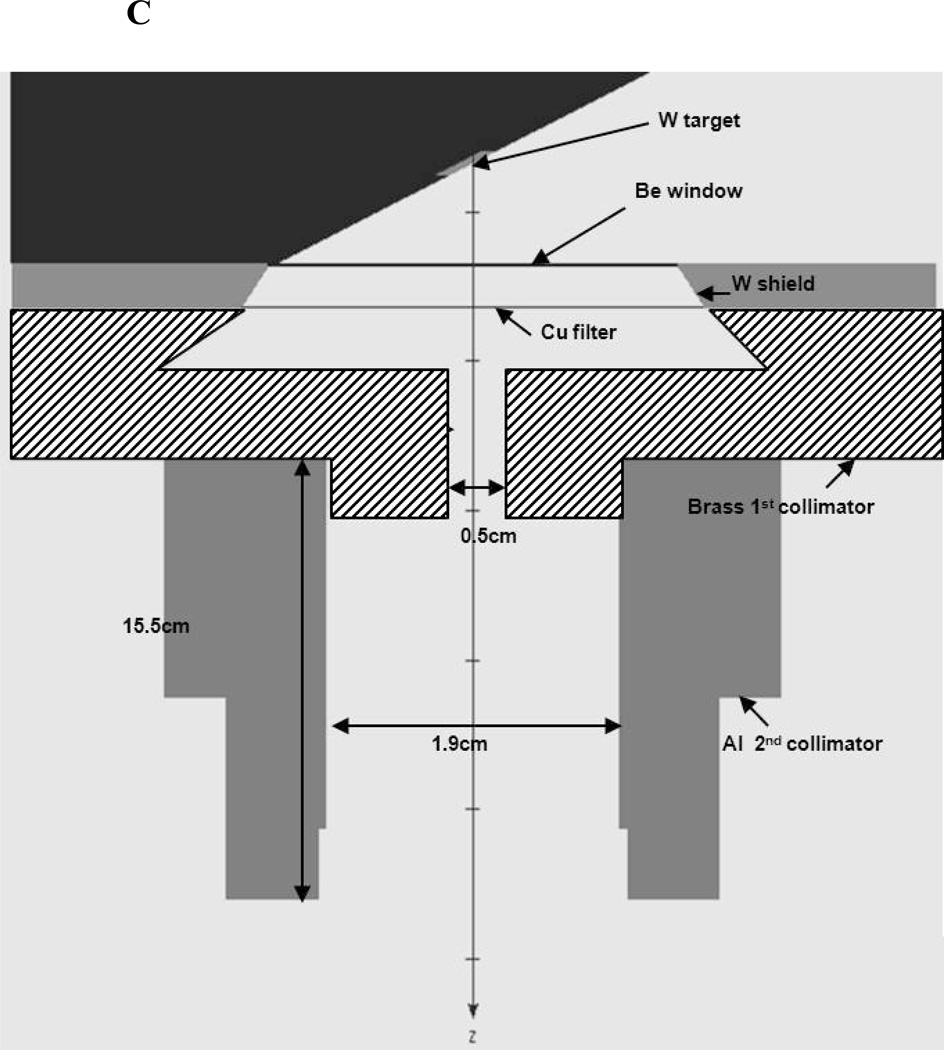
Fig. 3.
Comparison of Monte Carlo calculations with EBT-2 film dosimetry measurements. (A) Comparison of relative dose at 1 cm depth, SSD = 32.5 cm. The solid line represents Monte Carlo calculations and the circles represent film measurements. (B) Comparison of depth-dose at 10 mm depth for the heart collimator (SSD = 32.5 cm). The solid line represents Monte Carlo calculations and the circles represent film measurements. (C) Schematic of the collimator design rendered by BEAMnrc in x-z direction.


