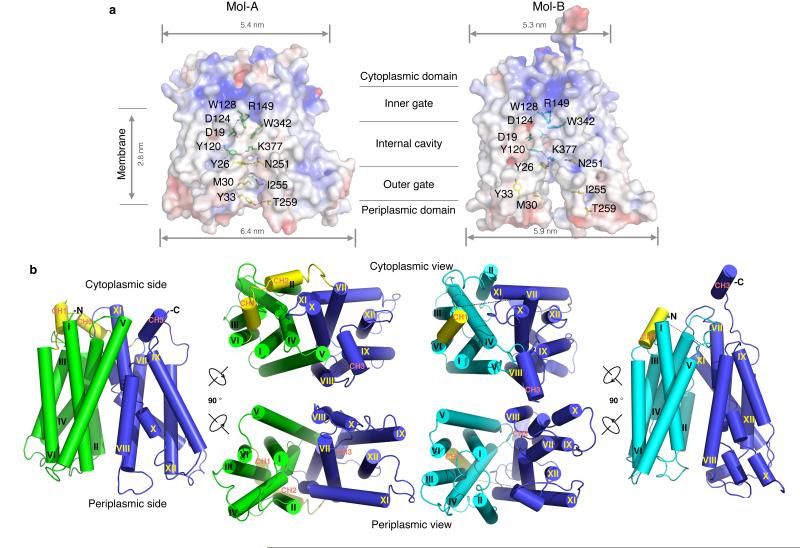
Figure 2. Crystal structures of MelBSt in two outward conformations.
a, Surface electro-potential maps with side-chains forming the outer gate and the internal cavity shown in yellow and green (Mol-A) or cyan (Mol-B) sticks. b, Overall structure of MelBSt. The N-terminal domains of Mol-A or Mol-B are shown in green and cyan, respectively, and the central loops are shown in yellow. The helices are labeled with Roman numerals. CH1-3 denote the helices in the cytoplasmic loops and the C-terminal tail. All figures showing MelB structures were prepared by Cα1-430 superposition of Mol-B on Mol-A.

