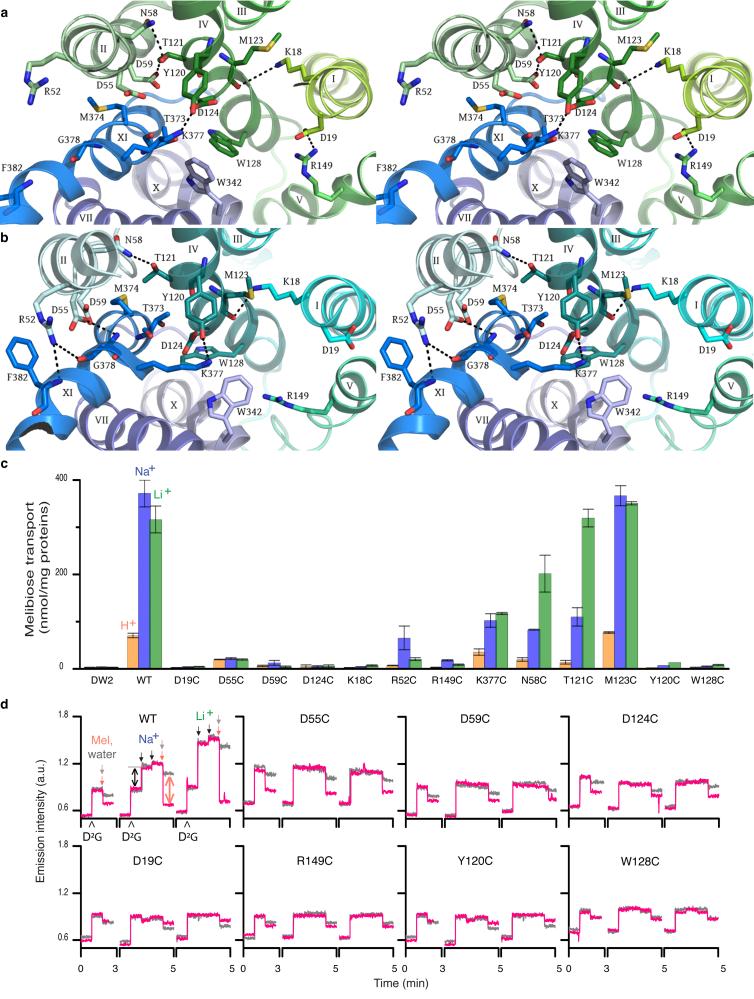
Figure 3. Co-substrate-binding sites.
a, Wall-eyed stereo view from the periplasmic side of the internal cavity in Mol-A with the N- and C-halves in green and blue, respectively. b, Identical view of Mol-B with N- and C-halves in cyan and blue, respectively. c, Steady-state levels of [3H]melibiose accumulation by intact cells at 10 min presented as histograms. DW2, cells without MelB. Error bar, s.e.m.; n = 2 for all mutants with a single-site mutation, and n = 10 for the WT and DW2. d, Trp→D2G FRET with RSO vesicles. The emission signals were collected at wavelength of 490 nm after excited at wavelength of 290 nm. Λ, adding 10 μM D2G; pink arrows  adding 120 mM melibiose; gray arrows
  adding water; black arrows ↓, adding 20 mM or 50 mM Na+ or Li+. Black double-headed arrows ↔, Na+ or Li+ stimulation; pink double-headed arrows
  , melibiose displacement of D2G.

