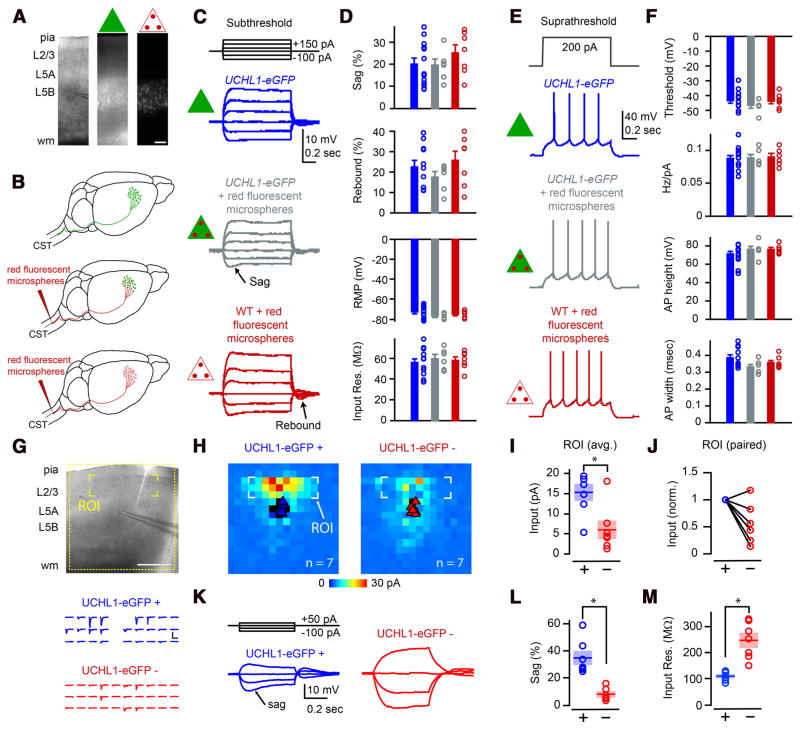
Figure 4.
eGFP+ neurons in motor cortex display electrophysiological and synaptic circuit properties of CSMN. A, Photomicrographs showing the location of eGFP neurons (green triangle) and CSMN retrogradely labeled with red fluorescent microspheres (triangle with red dots) within layer 5B of motor cortex. B, Drawing of experimental design: UCHL1-eGFP neurons (top, green triangle); retrogradely labeled CSMN in UCHL1-eGFP mouse (middle, green triangle with red dots); retrogradely labeled WT CSMN (bottom, triangle with red dots). C, Representative traces showing subthreshold responses to steps of injected current. D, Quantification of sag, rebound, RMP, and input resistance for eGFP+ neurons (blue), CSMN in UCHL1-eGFP mouse (gray), and WT CSMN (red). E, Representative traces of suprathreshold responses. F, Quantification of AP threshold, Hz/nA, AP height, and AP width in the three types of neurons. G, LSPS mapping of excitatory synaptic inputs. Postsynaptic responses were recorded while stimulating (by glutamate uncaging and LSPS) at multiple presynaptic locations. Traces below correspond to excitatory synaptic inputs from the layer 2/3 region of interest in the upper image (yellow brackets). Layer 2/3 inputs were stronger to eGFP+ neurons (blue traces) than to eGFP− neurons (red traces). H, Average synaptic input maps for eGFP+ (left) and eGFP− (right) neurons. I, J, Quantification of the strength of layer 2/3 input. K, Examples showing differences in subthreshold responses of eGPP+ and eGFP− neurons recorded during LSPS mapping experiments. Quantification of sag (L) and input resistance (M) showing differences between the labeled and unlabeled neurons. *p < 0.05 (Student’s t test). Error bars indicate SEM. Scale bars: A, 150 μm; G, 500 μm.

