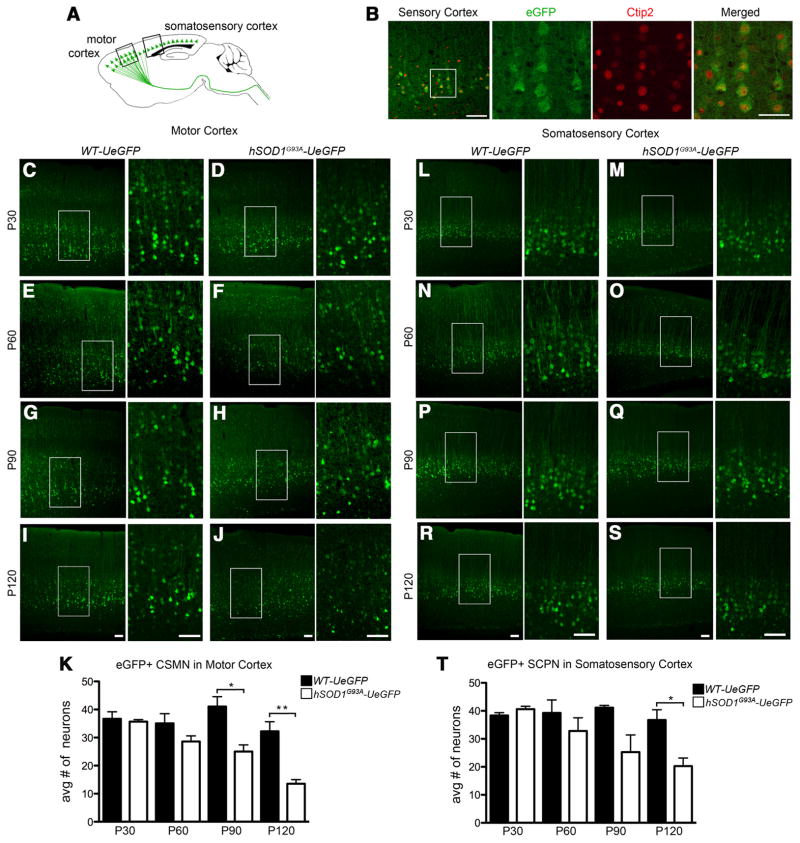
Figure 8.
Progressive degeneration of eGFP neurons in the motor and somatosensory cortex of hSOD1G93A-UeGFP mice. A, Drawing of a sagittal section of WT-UeGFP and hSOD1G93A-UeGFP mice. Boxed areas represent the location of the motor and somatosensory cortices used for quantification and are enlarged in left panels below and to the right. B, eGFP+ neurons located in the somatosensory cortex of UCHL1-eGFP transgenic mouse express Ctip2. C–J, Representative images of eGFP+ neurons in the motor cortex of WT-UeGFP (C,E,G,I) and hSOD1G93A-UeGFP (D,F,H,J) mice. K, Bar graph representation of the average number of eGFP+ neurons in the motor cortex of WT-eGFP and hSOD1G93A-UeGFP mice at P30, P60, P90, and P120. L–S, Representative images of eGFP+ neurons in the somatosensory cortex of WT-UeGFP (L,N,P,R) and hSOD1G93A-UeGFP (M,O,Q,S) mice. T, Bar graph representation of the average number of eGFP+ neurons in the somatosensory cortex of WT-eGFP and hSOD1G93A-UeGFP mice at P30, P60, P90, and P120. One-way ANOVA followed by Tukey’s post hoc multiple-comparison test and Student’s t test: *p < 0.05; **p < 0.001. Error bars indicate SEM. Scale bars (from left to right): B, 100 μm, 50 μm; C–J, L–S, 100 μm.

