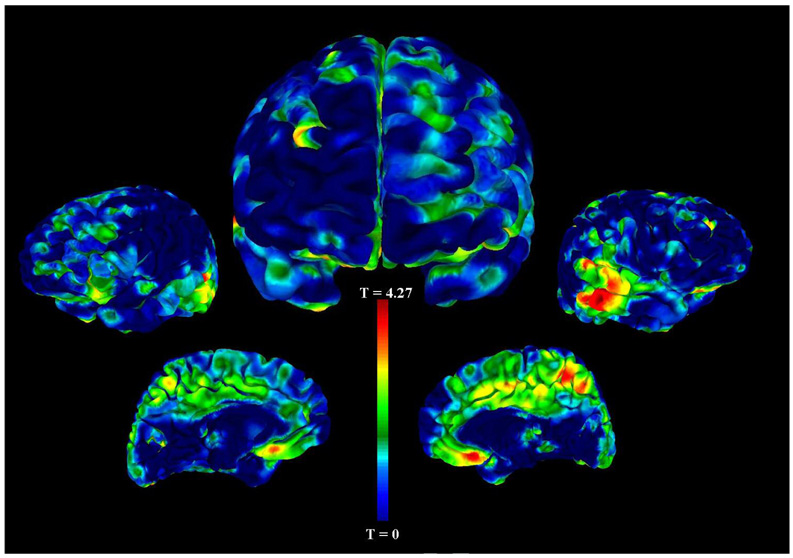
Figure 2. Gray Matter Volume Decreases in Controls with Enuresis compared with Controls without Enuresis.
This figure depicts the statistical main effects of regional gray matter volume decreases in healthy controls with a history of childhood enuresis versus those without a history. The unthresholded VBM results are overlaid on an AFNI pial surface and color-coded for the statistical t-score. The central figure is a frontal view, and the other figures, from left to right, are the left lateral, left medial, right medial, and right lateral hemispheric surface views. The most significant cluster of reduced gray matter volume in healthy controls with enuresis is the left middle temporal gyrus, BA 22 (coordinates x=−53, y=−43, z=3, p<0.001). There was also a cluster of decreased gray from the medial frontal gyrus, BA 11 extending into the subgenual cingulate (coordinates x=0, y=20, z=−12, p<0.001). Other clusters that were statistically significant are listed in Table 3.

