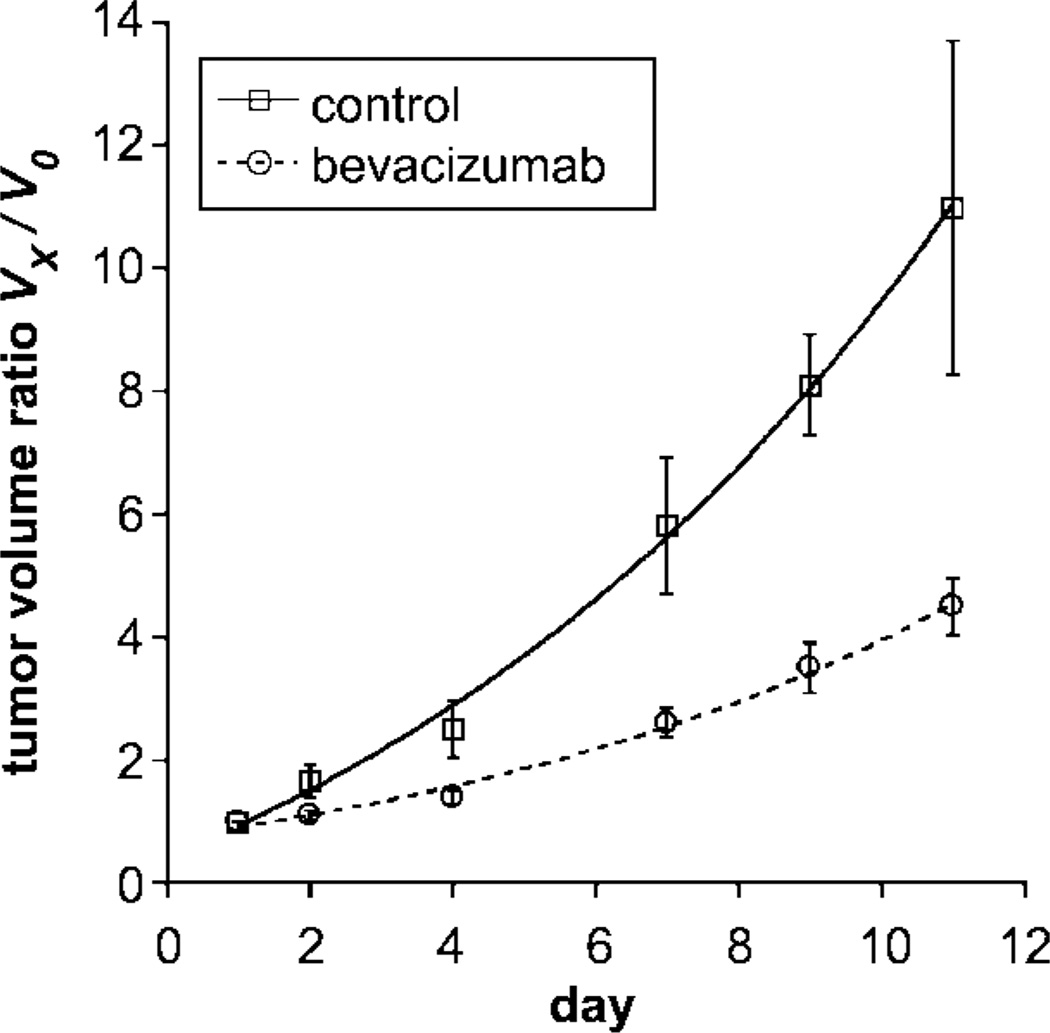
Figure 3.
Graph shows tumor volume ratios (tumor volume at day x [Vx] divided by baseline pretreatment tumor volume ([V0]) given as mean values ± standard errors of the mean (error bars) in control (saline-treated) and bevacizumab-treated tumors over 11 days. Curved lines represent monoexponenial best fits. The tumor volume ratio was significantly higher (P < .05) at the completion of tumor treatment (11 days) in the control, uninhibited, saline-treated tumors than in the bevacizumab-treated, angiogenically inhibited tumors.

