
Figure 5. Mutation of glutamic acids 24 and 25 within an electrostatic region of BAK diminishes binding of BAK to p53.
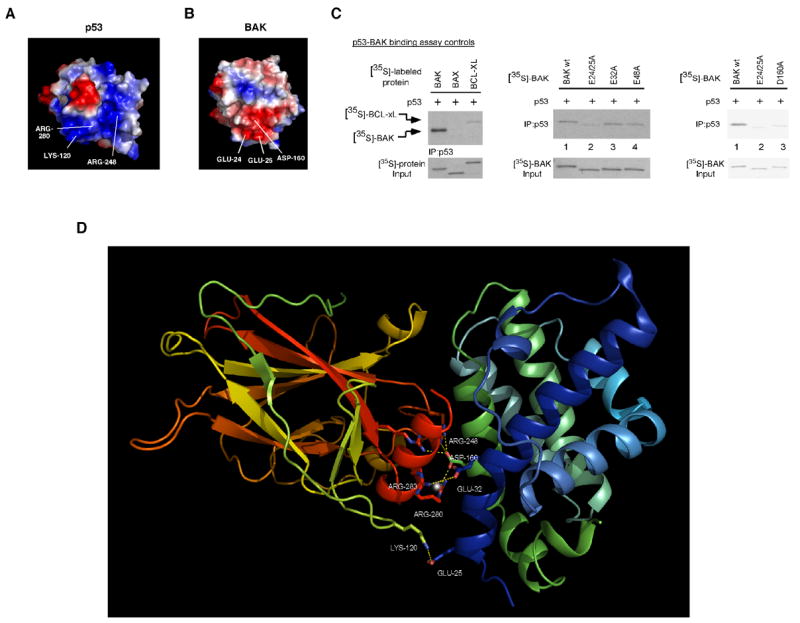
A) Surface diagram of p53 depicting electropositive (blue) and electronegative (red) areas within p53. Lysine 120, arginine 248, and arginine 280 together form an electropositive area on p53 (lower part of the molecule).
B) Surface diagram of BAK depicting electropositive (blue) and electronegative (red) regions. Glutamic acids 24 and 25 and aspartic acid 160 together form an electronegative area on BAK (lower part of the molecule).
C) Binding of in vitro translated p53 to [35S]-labeled in vitro translated Bcl-xl and BAX (left panel). In the middle panel, in vitro translated p53 was incubated with [35S]-labeled in vitro translated wild type BAK, or BAK mutated at glutamic acids 24/25 (E24/25), 32 (E32), and 48 (E48) to alanine. Following interaction, bound complexes were immunoprecipitated with a p53-specific antibody, washed extensively in 0.5% CHAPS buffer, separated by SDS-PAGE, and subjected to autoradiography (middle panel). In the right panel, in vitro translated p53 was incubated with the BAK mutants indicated (E24/25A and D160A) in 1% CHAPS binding buffer, and washed in 1% CHAPS binding buffer. Input lanes contain 1% of [35S]-labeled proteins used in the binding reaction.
D) Molecular model of the interaction of the p53 DBD with full length BAK. The backbone of the p53 DBD is on the left, colored in yellow, green, orange and red. The p53 H2 helix is highlighted in red while the L1 loop is highlighted in green. Critical p53 residues in the H2 helix and the L1 and L3 loop involved in the interaction with BAK are shown as ball and stick. The backbone of BAK is colored in green and blue, and BAK residues 25 and 160 are denoted.