Figure 6.
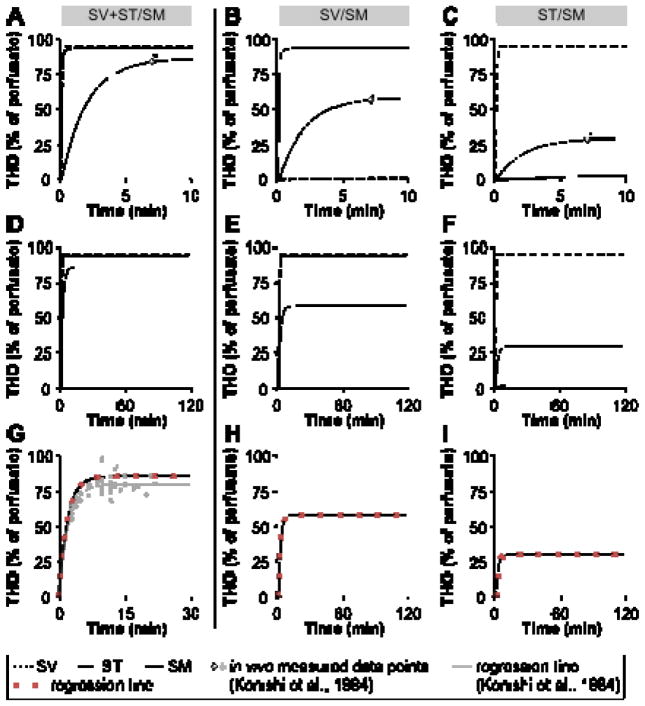
Simulations of time-dependent diffusional THO dispersal in the cochlear fluid compartments during perilymphatic tracer perfusion using the Cochlear Fluids Simulator (V. 1.6i). The program settings used for the simulations were adapted from the three experimental models SV+ST/SM, SV/SM, and ST/SM ([43]; Figure 2) and are provided in Table 3. (A–C) Simulations of the time-dependent THO dispersal in the perilymphatic and endolymphatic scalae during 10 min of perilymphatic THO perfusion in the SV and ST ((A), SV/SM), SV ((B), SV/SM), and ST ((C), ST/SM). Data points of endolymphatic THO concentration after 7 min (*) were obtained from in vivo experiments [43] and were used to fit the curve of endolymphatic THO concentration change by adjusting the parameter “scala-scala communication” (Table 3). (D–F) Simulation settings from (A–C) were applied to simulate the steady-state conditions of THO dispersal during 100 min of perilymphatic perfusion in the models SV+ST/SM (D), SV/SM (E), and ST/SM (F). (G–I) Curves of endolymphatic THO concentrations from D–I (black lines) were used for regression analyses based on equation (2). The obtained regression curves that best fit the simulation data are shown as red square lines. In (G), the in vivo measured data points of endolymphatic THO concentration (grey squares) and the corresponding regression line (grey line) derived from Konishi et al. [43] are shown. A comparison of the regression curve that was based on our in silico simulations (red square line) with the regression line derived from empirical data (grey line) revealed an almost identical slope and a similar plateau under steady-state conditions of both curves.

