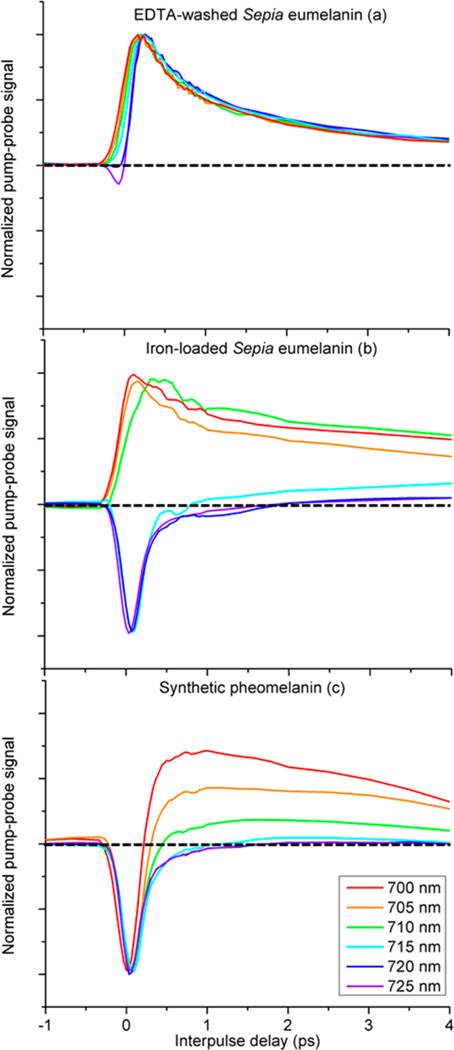
Figure 2.
Pump–probe response of dry melanins. Probe wavelength is set at 815 nm. Pump wavelength is varied from 700 to 725 nm. Data are normalized to the largest peak and smoothed using a 5 point, second-degree polynomial Savitzky–Golay filter to facilitate comparison of response curves with variable SNR levels.16

