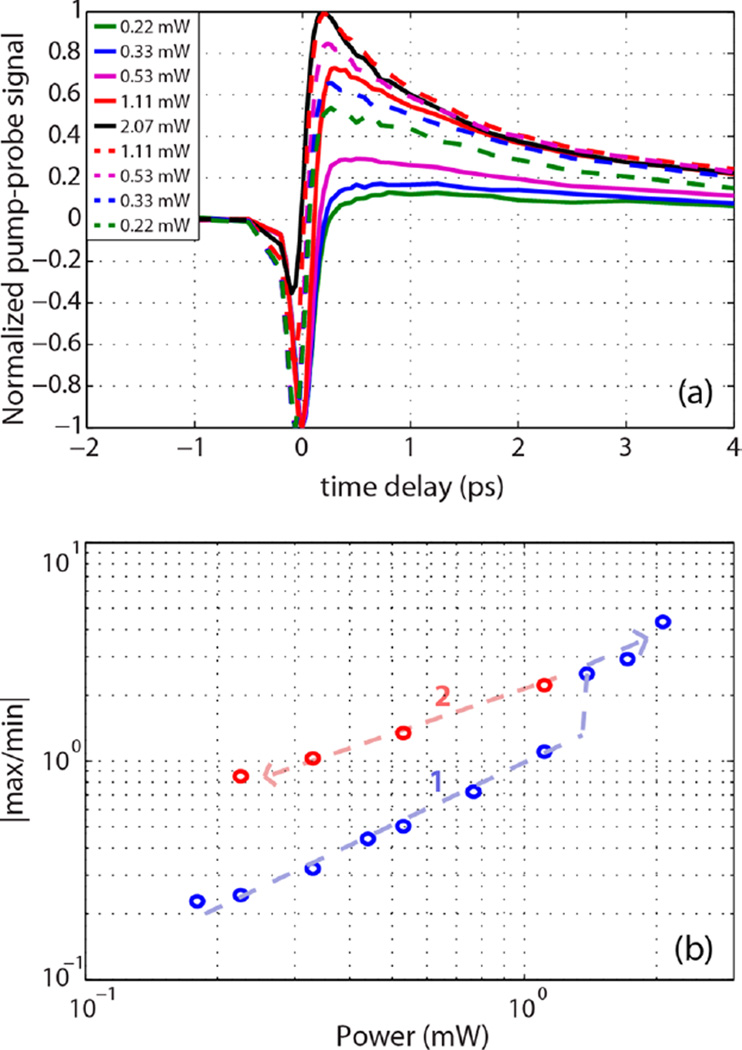
Figure 7.
(a) Pump–probe response of black hair as a function of power. Solid lines are taken with increasing power levels, and the dashed lines are taken with decreasing power levels after reaching the maximum power of 2 mW. Spectra were normalized by the maximum of the absolute value, (b) Ratio of maximum signal to minimum signal with increasing power. Arrows indicate the sequence of the experiment. Pump wavelength is 730 nm; probe wavelength is 810 nm.

