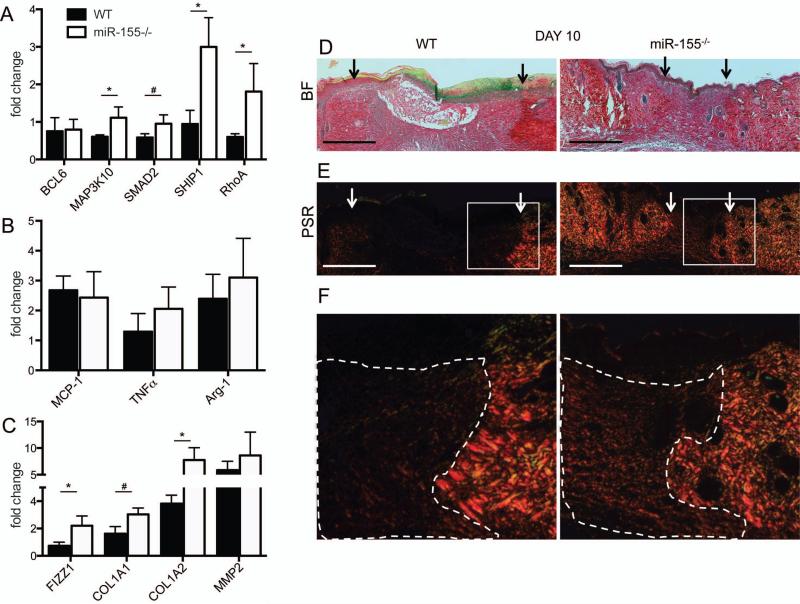
Figure 4. miR-155–/– targets and type-1 collagens are up regulated in mice lacking the expression of miR-155–/–
(A) Quantitative PCR of validated targets of miR-155; BCL6, MAP3K10, SMAD2, SHIP1, and RhoA show differential expression patterns in miR-155–/– mice compared to WT. (B) Quantitative PCR for specific markers of the M1 or M2 macrophage phenotype show no differences in expression between miR-155–/– mice compared to WT. (C) The expression levels of FIZZ1, COL1A1, Col1A2 are attenuated and MMP2 is unchanged when the two groups were compared. Results are shown as fold difference when compared to expression levels of healthy skin derived from combining WT and miR-155–/– mice. Results shown are mean +/- SEM, n=5 out of 10 per group, *P<0.05 and #P<0.1 with respect to WT, corrected for macrophage numbers using the expression levels of CD68. (D) Bright field pictures of wounds used in Fig 2B. (E) Representative wound sections stained for picrosirius red (PSR) shows enhanced staining for type-1 collagens (yellow/orange staining). Borders of wounds are depicted with arrows. Bars indicate 500 μm. (F). Areas that are boxed in are zoomed in to show differences in fluorescence. Dashed area depicts wounded area.

