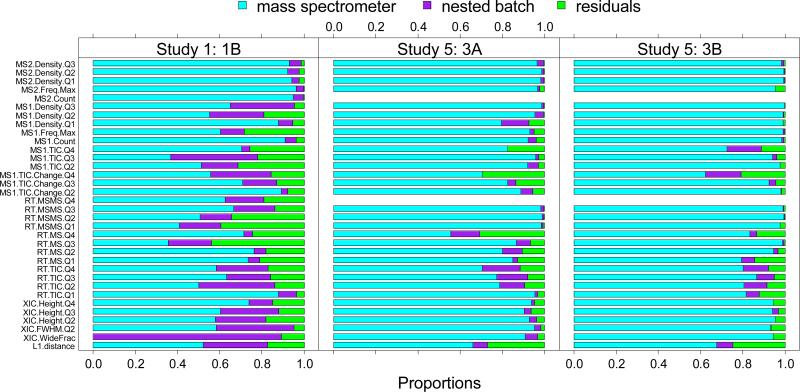
Figure 5.
Proportion of variability accounted by mass spectrometer effect, nested batch effect and random errors (residuals) estimated using the nested ANOVA model on each individual metric. Left: CPTAC Study 1 (within 70 days); middle: Sample 3A CPTAC Study 5; right: Sample 3B CPTAC Study 5. The final row of the graph reflects the combination of all metrics.

