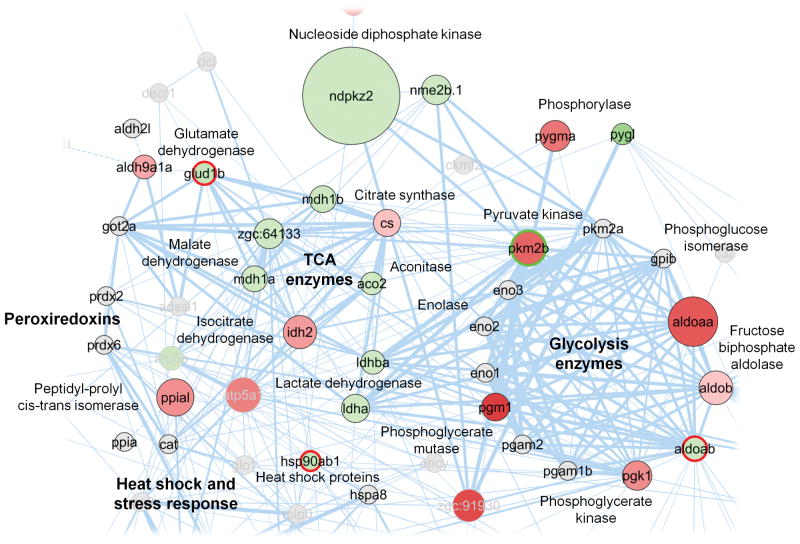
Figure 4.
Protein-protein interaction network visualization of sub-networks that contain proteins that showed changes in expression levels upon vitamin C deficiency in the vitamin E deficient state.
In the network each node represents a protein found in either group E−C+ or E−C−. The change in protein amounts between vitamin C adequate and deficient fish is color coded: green nodes represent proteins that increased their amounts, red represent those that decreased, grey nodes show proteins that were not quantified. The size of a node represents an average of the protein abundance estimates in the E+C− group. The width of a line connecting proteins represents the strength of proteins interaction, as extracted from STRING software. Subnetworks of proteins involved in glycolysis and the TCA cycle are highlighted as well as proteins associated with stress response.

