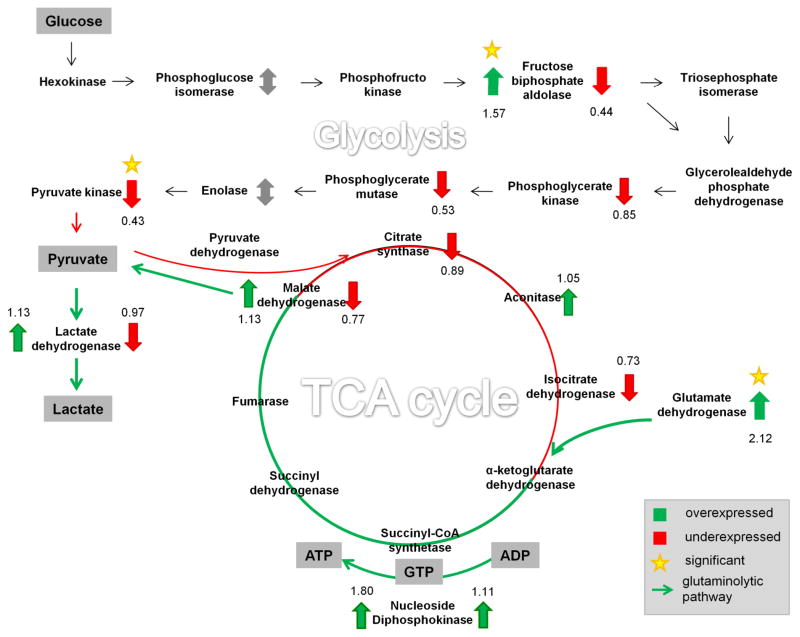
Figure 5.
Schematic of the metabolic pathways that were associated with proteins that showed changes in abundance estimates as a consequence of vitamin C deficiency.
To analyze the consequences of vitamin C deficiency, quantitative data was combined with metabolic pathways linked to energy production, namely glycolysis, TCA cycle and glutaminolysis. Proteins that were upregulated are indicated by a green arrow up, downregulated proteins are marked with a red arrow down, detected but not quantified proteins are marked with a double arrow in gray, and not detected proteins are unmarked. Proteins are labeled with their respective numerical fold-changes observed for vitamin C deficiency (in the vitamin E deficient group). Proteins that showed a statistically significant fold change are marked with an asterisk.

