Figure 8.
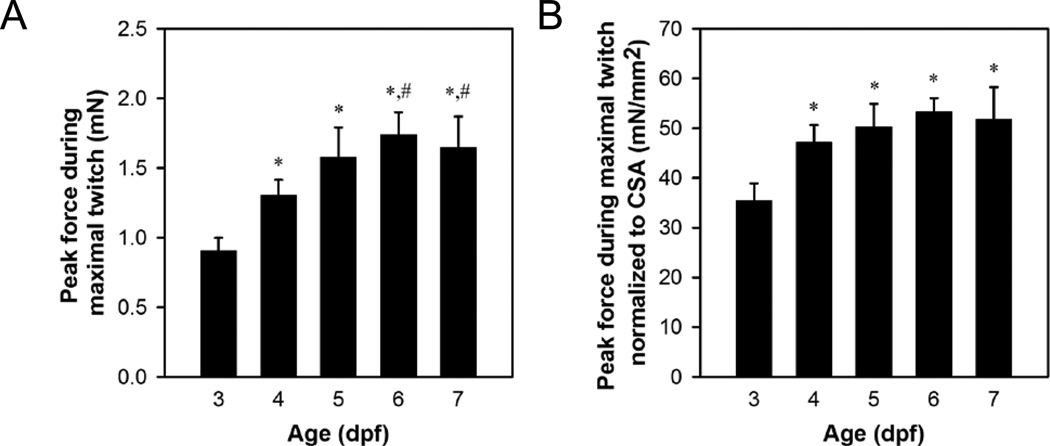
Representative force data from 3–7 dpf larvae. (A) Peak force data from maximal twitch contractions (B) Peak force data from maximal twitch contractions normalized to CSA. Older larvae (6–7 dpf) were fed Hatchfry Encapsulon Grade 0 with Spirulina (Argent Laboratories) starting on 5 dpf. Means + standard deviations are reported with N=5 in each group. Groups significantly different from 3 dpf larvae (*) and 4 dpf larvae (#) are indicated (ANOVA, P<0.05). The significant increase in normalized force between 3 and 4 dpf (B) indicates an increase in the intrinsic force generating capability during this time period, whereas the increase in force between 4 and 6–7 dpf (A) is attributed to growth based on no change from 4 to 7 dpf in normalized force.

