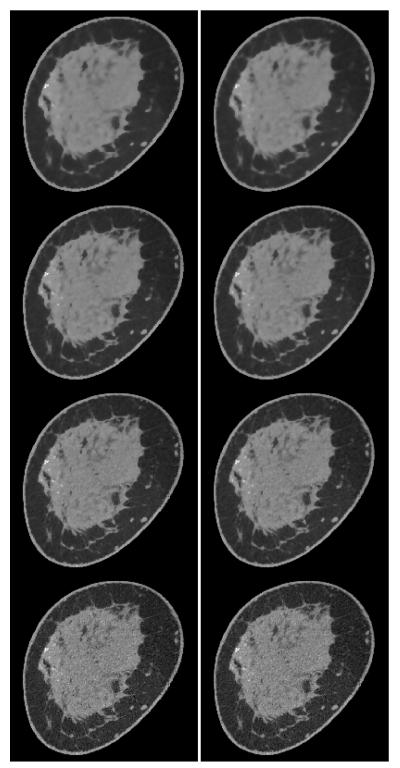
FIGURE 12.
Slice images obtained with TpV minimization from breast CT data for (left column) p = 0.5 and (right column) p = 0.8. The relative data-error RMSE increases from the bottom row to top row with values ∊’ = 0.011, 0.0115, 0.01175, and 0.012. The display gray scale window is [0.164,0.263] cm−1.

