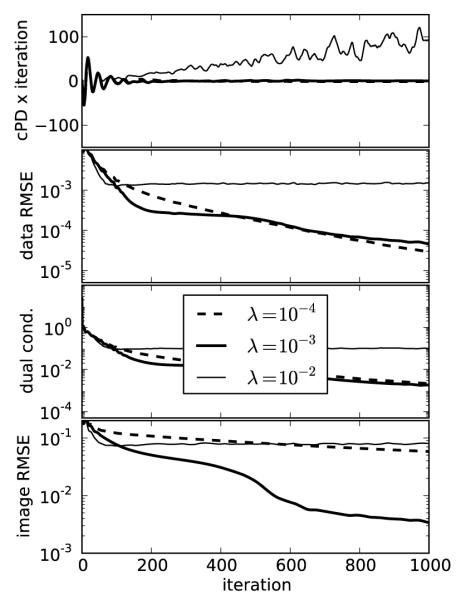
FIGURE 3.

Same as Figure 2 except p = 0.5 yielding a nonconvex constrained TpV minimization problem. For p < 1, selecting λ too large can lead to unstable behavior seen in the λ = 10−2 case as convergence metrics do not decay with iteration number. The fat normalized image RMSE plot is interesting in that the curve corresponding to λ = 10−3 shows a rapid drop at 500 iterations and correspondingly we see in Figure 4 that this run accurately recovers the phantom within the 1,000 iterations.
