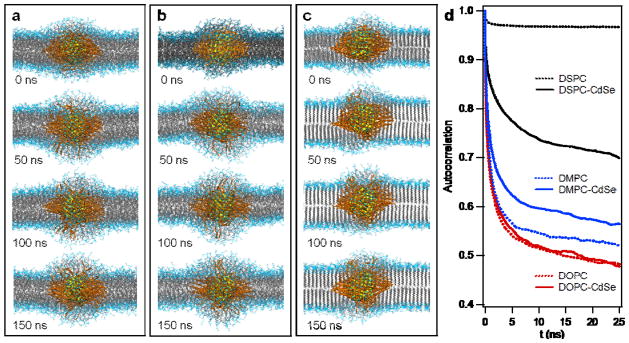
Figure 4. Atomistic MD simulation of L-QD assemblies.

Representative snapshots of atomistic MD simulation of 2.6 nm CdSe nanocrystal (0–150 ns) in fluid phase DOPC (a), DMPC (b), and gel phase DSPC vesicles (c). Lipid tails and OA ligands are shown in grey and orange, respectively. Solvent is omitted for clarity. d, Time correlation function of tail orientations for lipids perturbed by an embedded 2.6 nm CdSe QD (solid line) and lipids far from the QD (dotted line), averaged over the final 50 ns of simulation trajectories.
