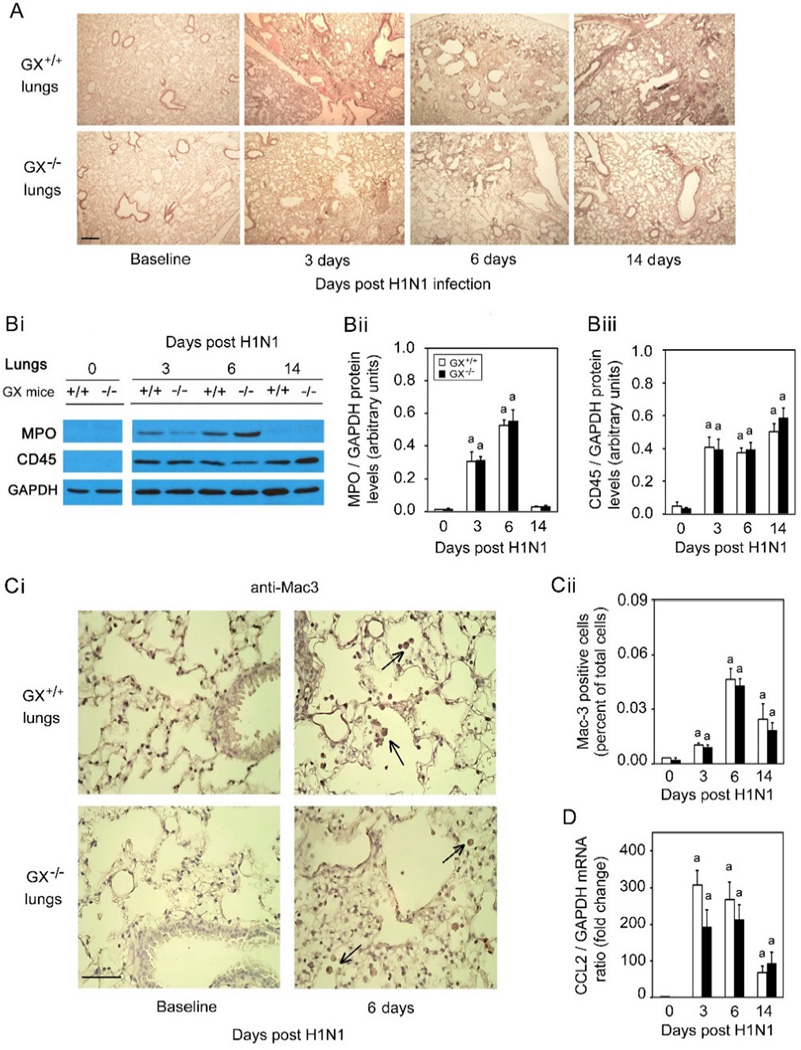
Figure 3. Infection with H1N1pdm influenza induces similar pulmonary inflammation and recruitment of inflammatory cells in GX+/+ and GX−/− mice.
GX+/+ and GX−/− mice (C3H/HeN background mice) were infected with H1N1pdm (A/Mexico/4108/2009) influenza and the lungs were perfusion fixed in situ with 4% paraformaldehyde on specific time points following infection, sectioned and subject to hematoxylin and eosin staining (A). MPO protein (neutrophil marker), CD45 protein (leukocyte marker) and GAPDH protein (loading control) expression levels were determined by immunoblot analysis from lung tissue homogenates of GX+/+ and GX−/− mice over a 14 day time course of H1N1pdm influenza infection (Bi). Densitometric analysis of MPO (Bii) and CD45 (Biii) protein levels normalized to GAPDH levels in lung tissue of GX+/+ (open bars) and GX−/− (filled bars) mice after H1N1pdm influenza infection, are presented. Immunohistochemical analysis with specific rabbit primary antibody against mouse Mac-3 antigen (marker for macrophages) is shown (Ci). Assessment of Mac-3 positive cells (indicated by →) per high power field before, three, six or fourteen days after infection with H1N1pdm influenza is shown (C ii). CCL2 mRNA expression normalized to GAPDH was determined by quantitative real-time PCR in lung tissue of GX+/+ and GX−/− mice after H1N1pdm influenza infection (D). Representative images (×200) from five independent experiments are shown. Scale bar: 100 µm (A) or 50 µm (C). a, p < 0.05 GX+/+ or GX−/− vs. base; b, p < 0.05 GX+/+ vs. GX−/− at any time point, ANOVA followed by paired t test, two tailed, assuming unequal variance. n≥8 per group.

