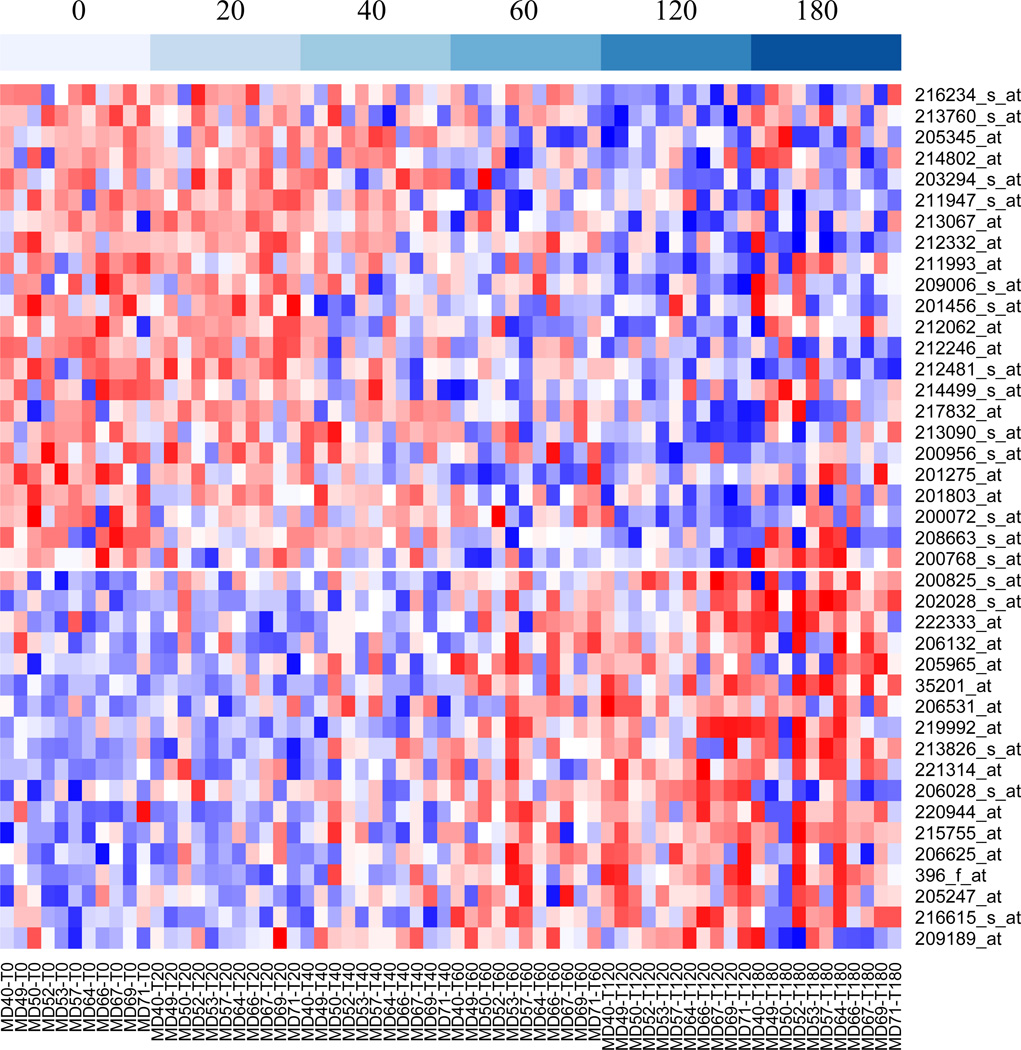
Figure 3.
Heatmap showing the expression levels of the 41 probe sets that were significantly affected by prolonged cold ischemic stress. Expression data were standardized to the same mean and standard deviation within each sample. Blue indicates low expression and red high expression. Probe sets were ordered from those most strongly reduced (top) to those most strongly induced (bottom) with increasing cold ischemic delay. Samples (columns) were ordered by cold ischemic delay, as shown at the top, and then by sample number.

