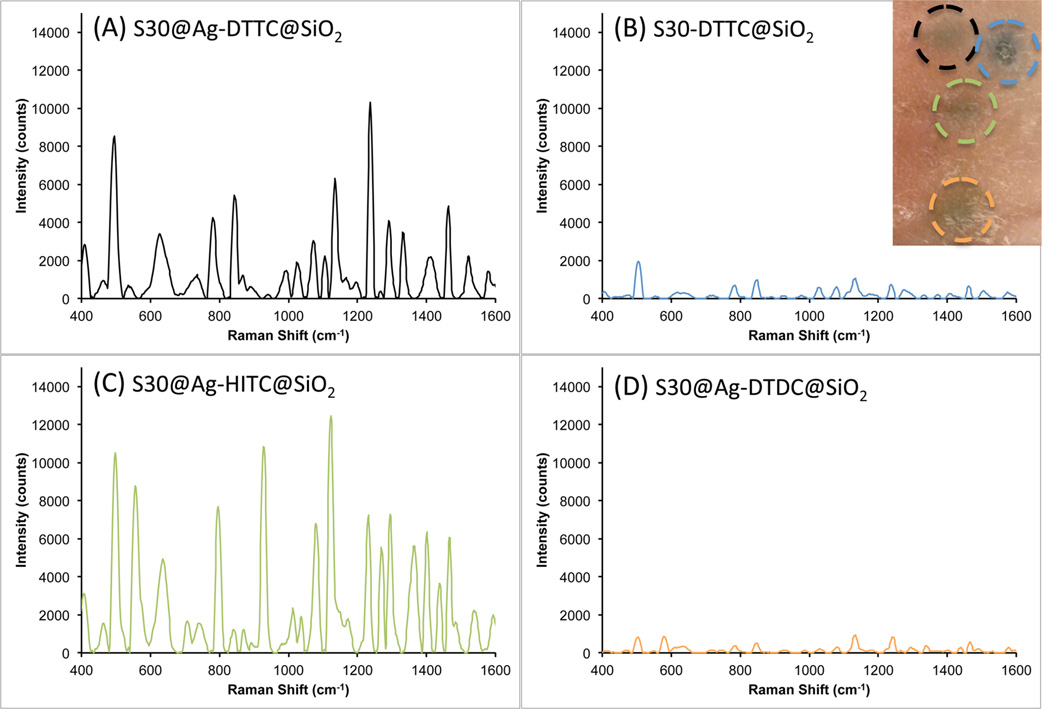
Figure 8.
Raman spectra (background subtracted) recorded from different SERS nanoprobes after intradermal injection into a rat pelt: (A) S30@Ag7-DTTC@SiO2, black; (B) S30-DTTC@SiO2, blue; (C) S30@Ag7-HITC@SiO2, green; (D) S30@Ag7-DTDC@SiO2, orange. The inset at top right shows the injection sites, each outlined in the color that matches the corresponding spectrum above.

