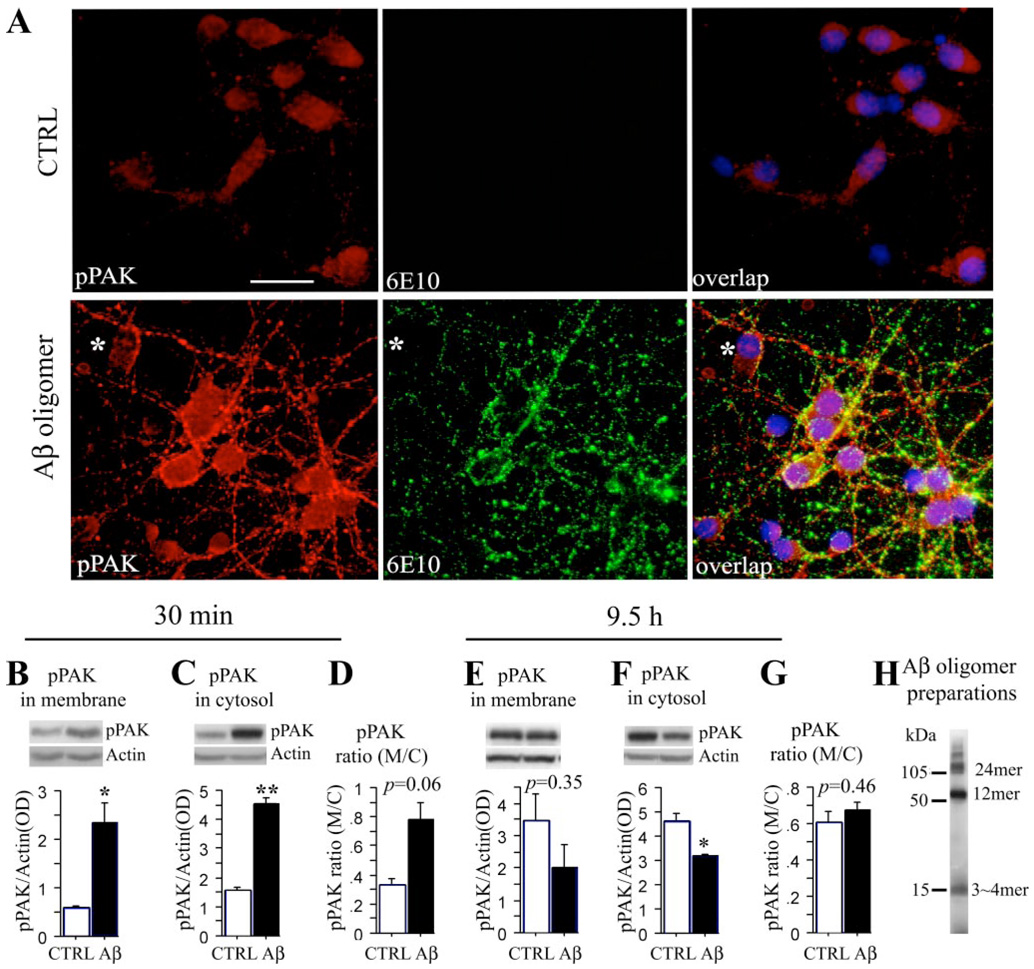
FIGURE 3. A• 42 oligomer-induced PAK activation and translocation in primary neurons.
A, immunofluorescent staining of PAK activation and translocation induced by A• 42 oligomer in primary hippocampal neurons. Primary hippocampal neurons 7 DIV were treated with 100 nm A• oligomers for 30 min and then stained with anti-pPAK (red), anti-A• (6E10, green), and the purple nuclear stain, 4•,6-diamidino-2-phenylindole; scale bar, 25 • m. CTRL, control. B–G, Western immunoblot analysis of PAK activation and translocation induced by A• 42 oligomer in primary hippocampal neurons. Hippocampal neurons 7 DIV were treated with 250 nm of A• oligomers and Western-blotted with anti-pPAK antibody. pPAK levels were significantly increased in membrane and cytosol (M/C) fractions after 30 min in A• 42 oligomer-treated neurons when compared with controls (B, *, p • 0.05; C, **, p • 0.01). The pPAK ratio of membrane to cytosol had a strong trend to increase by 30 min in A• 42 oligomer-treated neurons when compared with controls (D, p • 0.0630). In contrast pPAK levels were no longer increased in membrane fractions (E) and were significantly reduced in cytosol fraction by 9.5 h (F, *, p • 0.05). As a result, the membrane/cytosol ratio was no longer significantly altered (G). H, A• oligomer preparations detected by 6E10 antibody.

