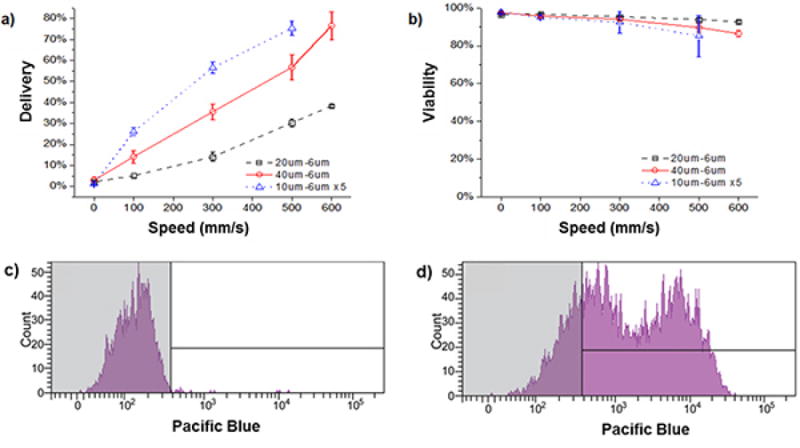
Figure 2. Representative results with HeLa cells20.

a) Delivery efficiency and b) cell viability of HeLa cells treated by 3 different device designs in the presence of cascade blue conjugated 3 kDa dextran (0.2 mg/mL). In these experiments, the cell solution was at a concentration of 106 cells per mL in PBS containing 3% fetal bovine serum and 1% F68 pluronics. Viability was measured by propidium iodide staining of dead cells and delivery results are shown for live cells only. All data points were run in triplicate, and error bars represent 2 SDs. c) A representative histogram for an experimental control where HeLa cells were exposed to cascade blue conjugated 3 kDa dextran for at least the same amount of time as a device treated case. d) The corresponding case where the cells were passed through the device to facilitate delivery. The fraction of the live cell population that is in the unshaded region of the histogram is defined as the ‘delivered’ population.
