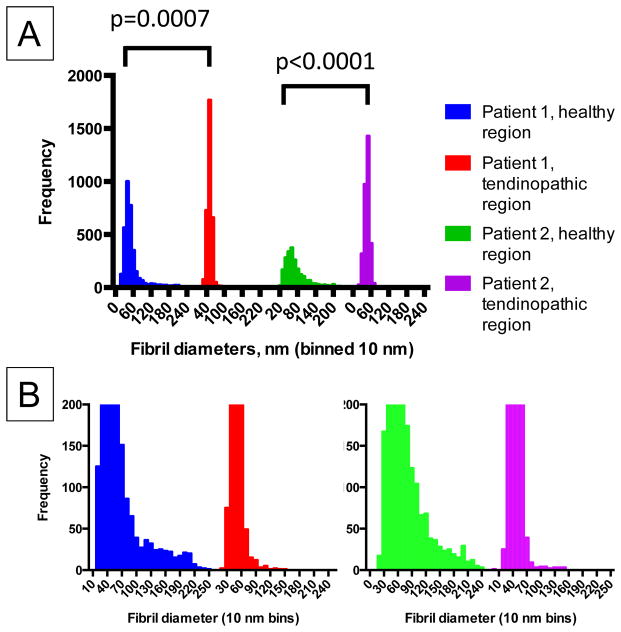
Figure 3. Fibril diameter distributions in healthy and tendinopathic regions.
(A) The frequency distributions of collagen fibril diameters from the healthy regions and tendinopathic regions of tendon from two patients are shown. (B) The data are re-plotted to illustrate the distribution of large diameter fibrils, which are most evident in healthy regions. P values show significant differences between healthy and tendinopathic regions (Mann-Whitney U non-parametric tests).

