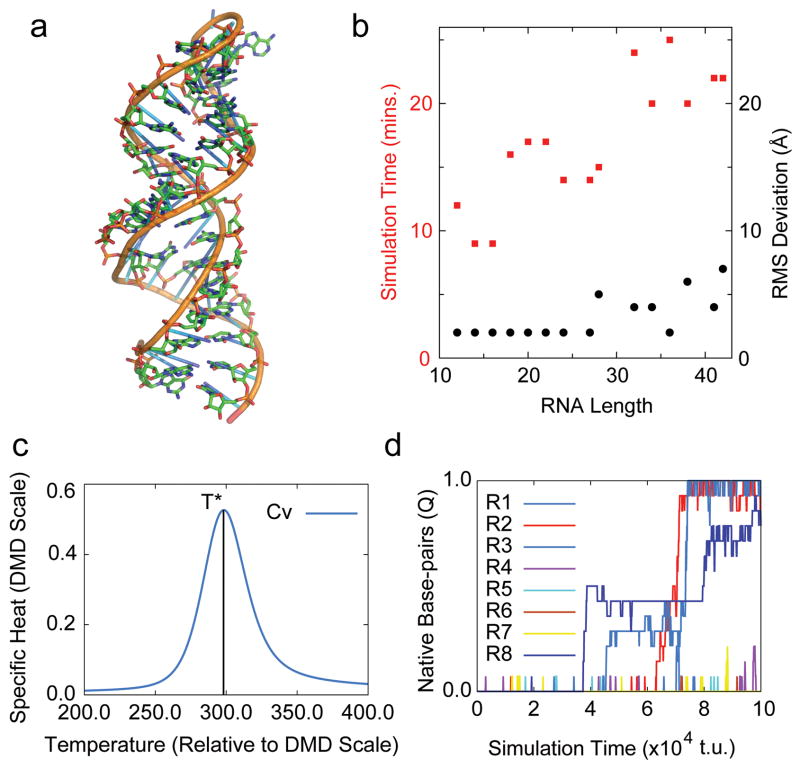
Fig. 1. iFoldRNA tertiary structure prediction and folding thermodynamics.
(a) Superposition of iFoldRNA generated stem-loop (sticks) vs. corresponding NMR structure (cartoon; Nucleic Acid DataBank: 1n8x; all-atom RMSD: 2.65 Å). (b) Scaling of iFoldRNA simulation times (red squares) and root mean square deviations (black circles) with increasing RNA length. Turnover time of RNA simulations is plotted as a function of total number of nucleotides in RNA. For intermediate-length RNA sequences (<50 nucleotides), simulation turnover times are within 30 minutes yielding 2–5 Å RMSD between predicted and experimental structures. (c) Graph of specific heat of the stem-loop (Nucleic Acid DataBank: 1n8x) vs. temperature generated using iFoldRNA-Analysis. Weighted histogram analysis method is used to compute the two-dimensional potential of mean force from replica-exchange DMD simulations. T* denotes the conformational transition temperature in relative DMD units. Figure generated using iFoldRNA-Analysis (d) Fractions of native-like base-pairs (Q-values) for eight replicas (R1-R8) in the model 1n8x folding simulation. Replicas (R1, R2, R8) explore native-like conformations with Q-values ~1.0 within 1×10⁵ time units of replica exchange DMD simulation. Graph generated by iFoldRNA using GNUPlot software.

