Fig. 6.
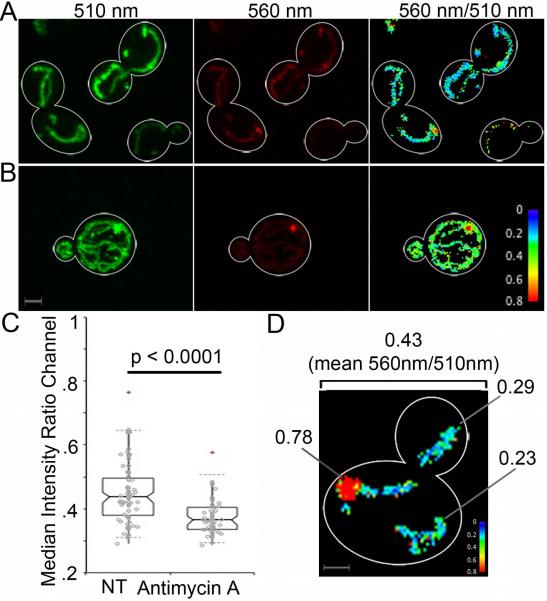
MitGO-ATeam2 measures changes in ATP levels in yeast mitochondria at subcellular and suborganellar resolution. (A–B) Emission of mitGO-ATeam2 from GFP (510 nm) and OFP (560 nm), and quantitation of the 560/510 nm emission ratio of yeast cells grown overnight in glucose-based (SC) (A) or glycerol-based (SGlyc) (B) media. The color reference for the 560/510 ratio channel is shown at lower right. Bar: 1 μm. (C) Quantitation of the 560/510 ratio for cells propagated in SGlyc media with or without antimycin A (2 μg/ml) for 1 hr at 30°C. The decrease in ATP levels upon antimycin A treatment is statistically significant (Kruskal-Wallis significance test). (D) 560 nm/510 nm ratio of mitGO-ATeam2 of a midlog phase wild-type cell propagated on SC media. The color reference for the 560/510 ratio channel is shown at lower right. The cell outline is shown in white. The mean 560/510 nm ratio for the entire cell is 0.43. The numbers shown are the 560/510 nm ratios of specific regions within mitochondria. Bar: 1 μm.

