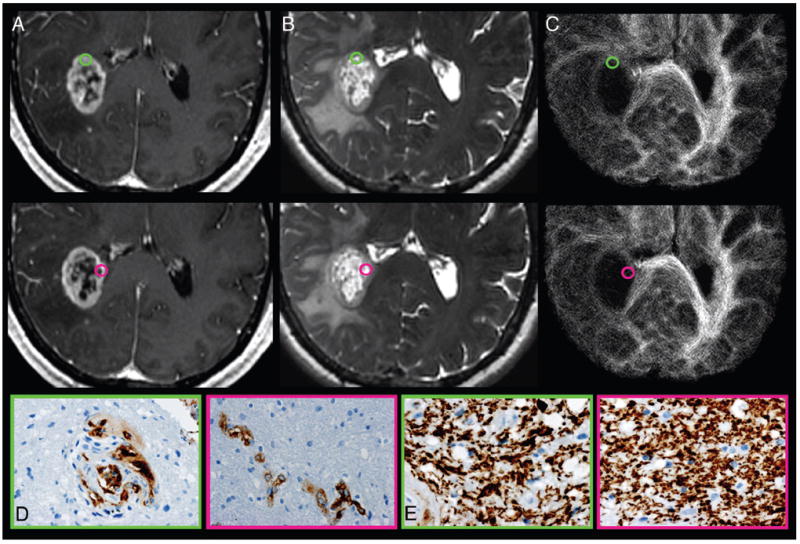
FIG 2.

Track density imaging correlation with histopathologic measures of GBM obtained from stereotactic tumor tissue specimens from CE regions. A, Axial CE T1-weighted spoiled gradient-recalled and (B) FSE-T2 coregistered with (C) TDI shows the preoperatively selected tumor regions from patient 7. Green-and-pink tissue samples obtained from similar-appearing CE regions demonstrate the regional correlation between relative track density and microvascular hyperplasia (Factor VIII). No correlation between relative track density and architectural disruption (SMI-31) was observed within the CE regions. Tissue specimens stained for Factor VIII (D) and SMI-31 (E) show elevated microvascular hyperplasia (brown stain; green, 2) vs lower vascular hyperplasia (pink, 1) and similar architectural disruption (green and pink, 1) within regions of elevated relative track density (gold, 1.59) vs decreased values (purple, 0.43). Despite the similar morphologic appearance on anatomic MR imaging, the 2 CE tumor tissue sites demonstrate markedly different measures of microvascular hyperplasia, which correlate with relative track density measurements. This correlation suggests that the degree of vascular hyperplasia exerts a greater biologic influence on TDI than architectural disruption, which is in contrast to the observed biologic effects on TDI within NE regions.
