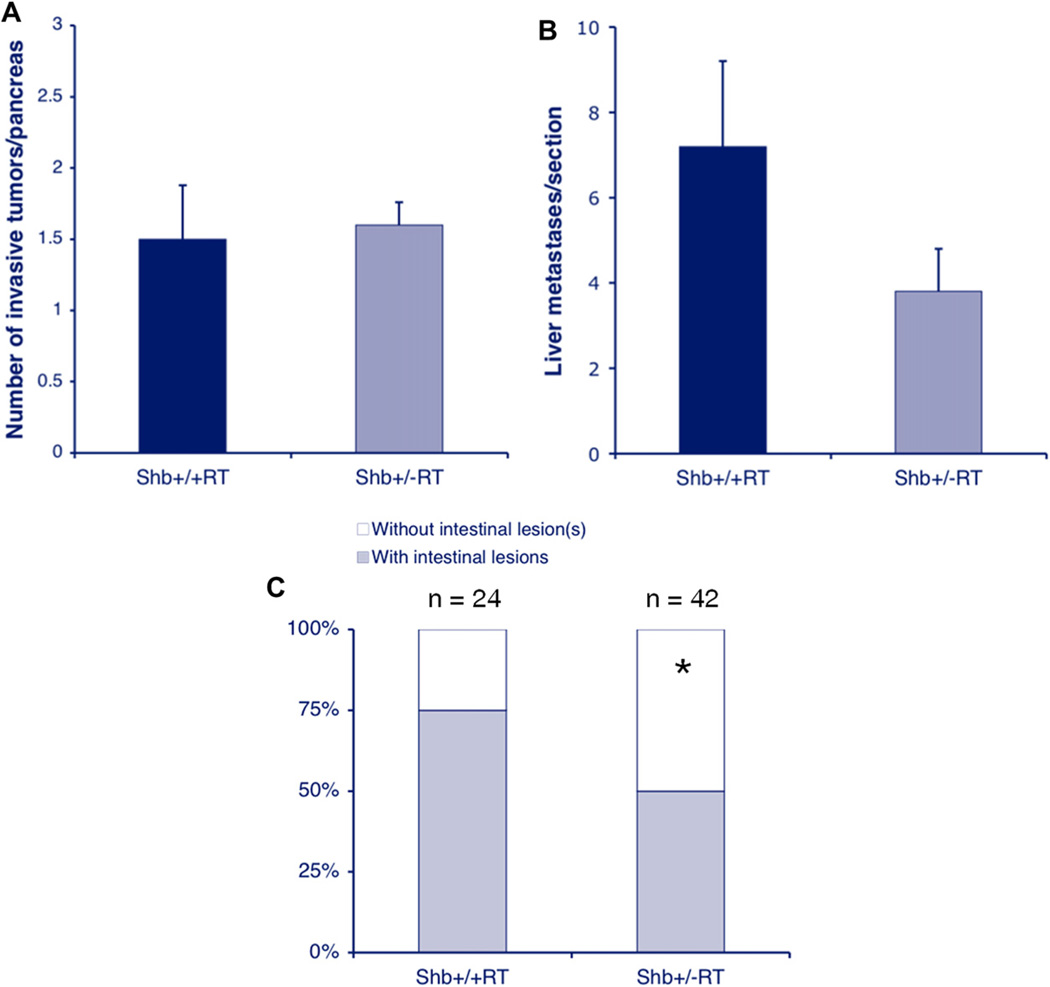
Figure 6.
Tumor invasiveness (A), liver metastasis (B) and intestinal lesions (C) of wild-type and Shb+/−RT2 tumors. Means ± SEM for invasiveness and liver metastasis and number of mice with intestinal lesions are given. For invasiveness, values are from 6 to 10 mice and for liver metastasis 15 sections from 5 mice of each genotype were analyzed. * indicates p < 0.05 with chi-square test.

