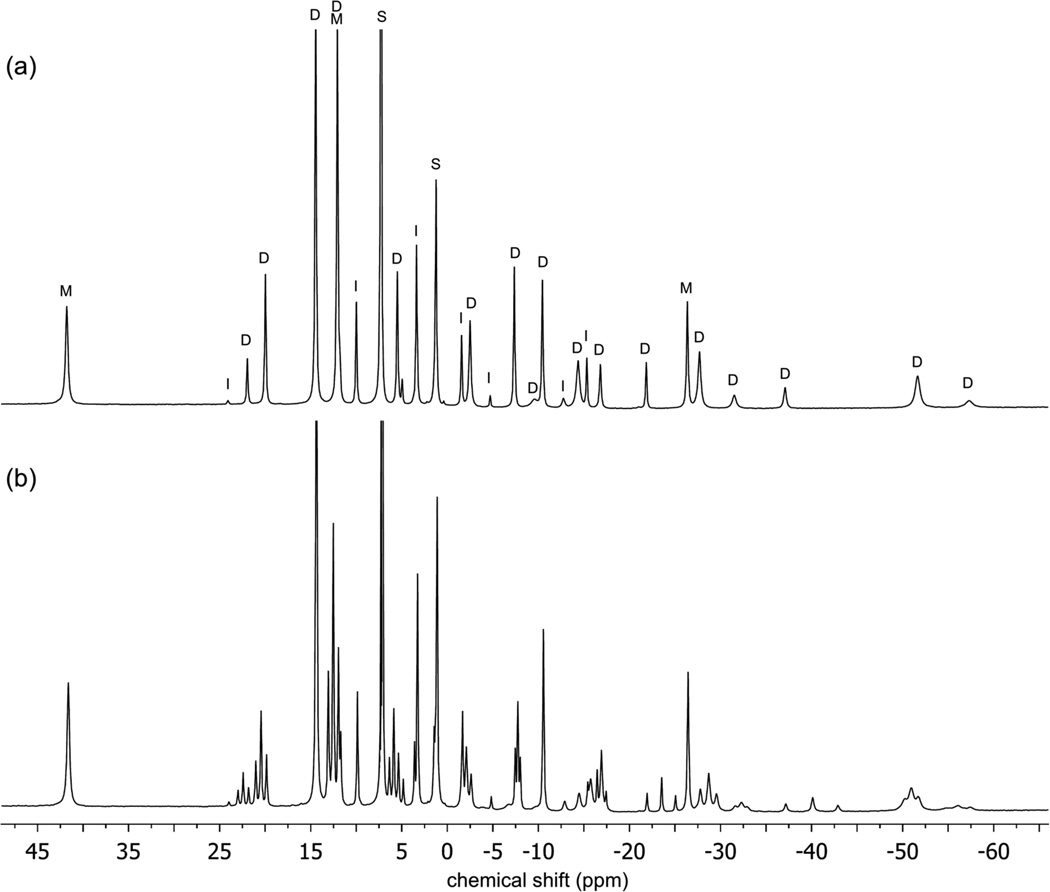
Figure 1.
(a) 1H NMR spectrum of [LtBuFe(µ-H)]2 (1) in C6D6. This particular sample has a 7% impurity of the oxo complex {LtBuFe}2(µ-O). Peaks for the dimer are marked with D, for monomers with M, for the oxo impurity with I, and for solvent and solvent impurities with S. (b) 1H NMR spectrum from mixing equimolar amounts of [LtBuFe(µ-H)]2 (1) and [LtBuFe(µ-D)]2 (1-D2) in C6D6 for 45 min. All three isotopologues of the dimer (H/H, H/D, and D/D) are visible in (b), as several groups of three nearby peaks in a statistical 1:2:1 ratio. Only the parts of the spectra from δ 45 to −70 ppm are shown for clarity.

